Download
1 / 1
10 likes | 193 Views
DATA. CENTER. Sample Preparation and Data Processing for Macrophage Ligand Screen. Navigating Single Ligand Screen. from AfCS Data Center: . RAW 264.7 ligand screen. Cell Preparation and Analysis Lab Goal: 23 ligands and their 253 paired combinations: conduct each 3 times on different days

E N D
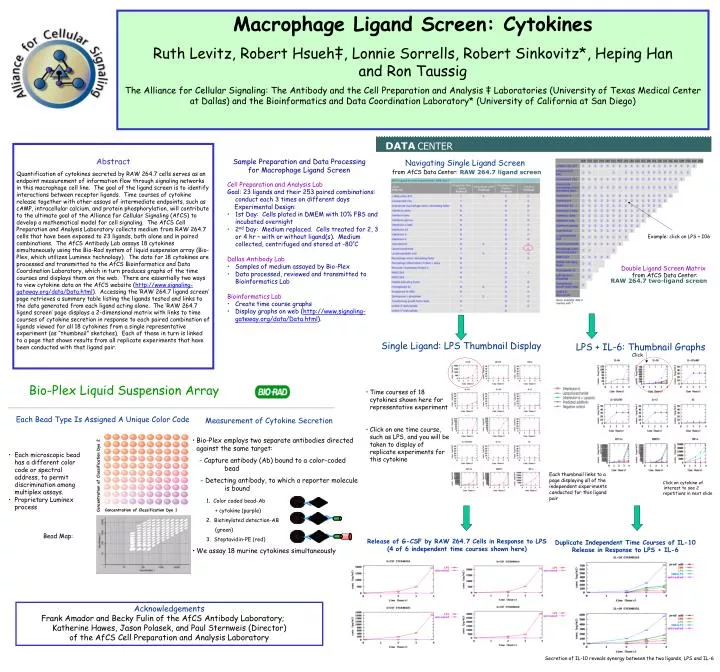
DATA CENTER Sample Preparation and Data Processing for Macrophage Ligand Screen Navigating Single Ligand Screen from AfCS Data Center: RAW 264.7 ligand screen • Cell Preparation and Analysis Lab • Goal: 23 ligands and their 253 paired combinations: conduct each 3 times on different days • Experimental Design: • 1st Day: Cells plated in DMEM with 10% FBS and incubated overnight • 2nd Day: Medium replaced. Cells treated for 2, 3 or 4 hr – with or without ligand(s). Medium collected, centrifuged and stored at -80oC • Dallas Antibody Lab • Samples of medium assayed by Bio-Plex • Data processed, reviewed and transmitted to Bioinformatics Lab • Bioinformatics Lab • Create time course graphs • Display graphs on web(http://www.signaling-gateway.org/data/Data.html). Example: click on LPS + I06 Double Ligand Screen Matrix from AfCS Data Center: RAW 264.7 two-ligand screen Bio-Plex Liquid Suspension Array Each Bead Type Is Assigned A Unique Color Code Measurement of Cytokine Secretion • Bio-Plex employs two separate antibodies directed against the same target: • - Capture antibody (Ab) bound to a color-coded bead • - Detecting antibody, to which a reporter molecule is bound • 1. Color coded bead-Ab • + cytokine (purple) • 2. Biotinylated detection-AB • (green) • 3. Steptavidin-PE (red) • We assay 18 murine cytokines simultaneously Concentration of Classification Dye 2 • Each microscopic bead has a different color code or spectral address, to permit discrimination among multiplex assays. • Proprietary Luminex process Each thumbnail links to a page displaying all of the independent experiments Click on cytokine of conducted for this ligand interest to see 2 pair Concentration of Classification Dye 1 repetitions in next slide Y Y Y Bead Map: Y Y Release of G-CSF by RAW 264.7 Cells in Response to LPS (4 of 6 independent time courses shown here) Duplicate Independent Time Courses of IL-10 Release in Response to LPS + IL-6 Secretion of IL-10 reveals synergy between the two ligands, LPS and IL-6 Macrophage Ligand Screen: Cytokines Ruth Levitz, Robert Hsueh‡, Lonnie Sorrells, Robert Sinkovitz*, Heping Han and Ron Taussig The Alliance for Cellular Signaling: The Antibody and the Cell Preparation and Analysis ‡ Laboratories (University of Texas Medical Center at Dallas) and the Bioinformatics and Data Coordination Laboratory* (University of California at San Diego) Abstract Quantification of cytokines secreted by RAW 264.7 cells serves as an endpoint measurement of information flow through signaling networks in this macrophage cell line. The goal of the ligand screen is to identify interactions between receptor ligands. Time courses of cytokine release together with other assays of intermediate endpoints, such as cAMP, intracellular calcium, and protein phosphorylation, will contribute to the ultimate goal of the Alliance for Cellular Signaling (AfCS) to develop a mathematical model for cell signaling. The AfCS Cell Preparation and Analysis Laboratory collects medium from RAW 264.7 cells that have been exposed to 23 ligands, both alone and in paired combinations. The AfCS Antibody Lab assays 18 cytokines simultaneously using the Bio-Rad system of liquid suspension array (Bio-Plex, which utilizes Luminex technology). The data for 18 cytokines are processed and transmitted to the AfCS Bioinformatics and Data Coordination Laboratory, which in turn produces graphs of the time courses and displays them on the web. There are essentially two ways to view cytokine data on the AfCS website (http://www.signaling-gateway.org/data/Data.html). Accessing the ‘RAW 264.7 ligand screen’ page retrieves a summary table listing the ligands tested and links to the data generated from each ligand acting alone. The ‘RAW 264.7 ligand screen’ page displays a 2-dimensional matrix with links to time courses of cytokine secretion in response to each paired combination of ligands viewed for all 18 cytokines from a single representative experiment (as “thumbnail” sketches). Each of these in turn is linked to a page that shows results from all replicate experiments that have been conducted with that ligand pair. Single Ligand: LPS Thumbnail Display LPS + IL-6: Thumbnail Graphs Click • Time courses of 18 cytokines shown here for representative experiment • Click on one time course, such as LPS, and you will be taken to display of replicate experiments for this cytokine Acknowledgements Frank Amador and Becky Fulin of the AfCS Antibody Laboratory; Katherine Hawes, Jason Polasek, and Paul Sternweis (Director) of the AfCS Cell Preparation and Analysis Laboratory