Download

1 / 99
1.09k likes | 1.35k Views
FREQUENCY RESPONSE OF AC CIRCUIT. TRANSFER FUNCTION (TF). Frequency response can be obtained by using transfer function. DEFINITION: Transfer function, H( ) is a ratio between output and input. TRANSFER FUNCTION. Output signal. Input signal. 4 condition of TF:. Because there is no

E N D
TRANSFER FUNCTION(TF) • Frequency response can be obtained by using transfer function.
DEFINITION: Transfer function, H() is a ratio between output and input.
TRANSFER FUNCTION Output signal Input signal
4 condition of TF: Because there is no unit, they are called GAIN
KUTUB DAN SIFAR (POLES AND ZEROS) • Transfer function is written in fraction • The numerator and denominator can be existed as a polynomial
The roots of numerator also known as ZEROS. Zeros exist when N()=0 • The roots of denominator also known as POLES. Poles exist when D()=0
KUTUB DAN SIFAR • The symbol for pole is x • The symbol for zero is o • Complex s-plane is used to plot poles and zeros.
POLES/ZEROS quadratic zero Poles/zeros at the origin real zero real pole quadratic pole
LOCATION OF POLES/ZEROS • Zeros/poles at the origin: Zeros/poles that are located at 0 • Real Zeros/poles: Zeros/poles that are located at real axis (-1,-2,1,2,10,etc) • Quadratic Zeros/poles:Zeros/poles that are not located at imaginary or real axis (-1+j2, 2+j5, 3-j3, etc)
ZEROS • Let numerator, N()=0
POLE • Let denominator, D()=0
FREQUENCY RESPONSE PLOT USING SEMILOG GRAPH
MAGNITUDE PLOT AND PHASE PLOT • magnitude plot • phase angle plot
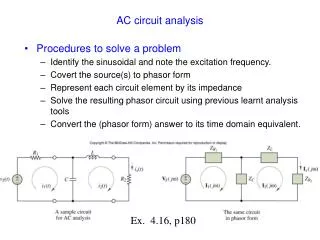
HOW TO DO MAGNITUDE AND PHASE PLOT • Transform the time domain circuit (t) into freq. domain circuit (ω) • Determine the TF, H(ω) • Plot the magnitude of that tf, H(ω)against ω. • Plot the phase of that tf, (º) against ω.
OBTAINED THE TF • Input is Vi dan Output is Vo,
BODE PLOTS • Bode plots are semilog plots of magnitude (in decibels) and phase (in degrees) of a transfer functionversus frequency
DECIBEL SCALE • Logarithm
GAIN • Gain is measured in bels
GENERAL EQUATION OF TF • Before draw, make sure the general equation of tf is obtained first:
EX. COMPARE
(1) (GAIN) constant
Magnitude for constant is : Phase angle for constant is: CHARACTERISTICS
magnitude plot phase plot f BODE PLOT FOR CONSTANT
Magnitude: Straight line with 20dB/dec of slope that has a value of 0 dB at =1 Phase: CHARACTERISTIC OF (jω)N