Download
1 / 34
350 likes | 480 Views
Nutrition & Child Health Status: Correlation Analysis. Malnutrition. Importance: Knowledge of determinants of malnutrition : A pre -requisite for targeted intervention programs and policies. Costs: Causes a great deal of human suffering (both physical and emotional).

E N D
Nutrition & Child Health Status:Correlation Analysis Source: Babu and Sanyal (2009)
Malnutrition • Importance: • Knowledge of determinants of malnutrition : A pre -requisite for targeted intervention programs and policies. • Costs: • Causes a great deal of human suffering (both physical and emotional). • Apart from the human costs, chronic malnutrition has economic costs too. Deficiencies in vitamin A, protein, iron and other micronutrients can cause prolonged impairment, thus reducing productivity of human capital. • Causes: • Inadequate food intake, mother’s education and care, health status and environmental factors. The immediate determinant of nutritional status is dietary intake (calories, protein, fat, micronutrients, carbohydrates and vitamins). • Dietary intake must be sufficient in quantity and quality and nutrients must be consumed in appropriate combinations for the child to absorb them. Nutrition & Child Health Status:Correlation
Malnutrition • Causes of Child malnutrition • Poverty - inadequate own food production, income or in-kind transfers of food for gaining access to food. • Women’s education and nutritional knowledge play an equally important role. Women with at least secondary education tend to have fewer children and have better knowledge of feeding and caring practices. These knowledge and skills improve the caring practices and thereby positively influence the nutritional status of the child. • Health environment and services - safe water, sanitation, health care and environmental safety. Nutrition & Child Health Status:Correlation
Policy Challenges • Identify factors with positive or negative association with child nutrition. • It is important to understand the factors that are associated strongly with child nutrition, so that appropriate actions could be taken to improve those causal factors thereby improving child nutrition. Nutrition & Child Health Status:Correlation
Policy Imperatives • Knowledge on nature and extent of association among different anthropometric indicators (weight for age, height for age and weight for height Z-scores). • Needed for program monitoring and evaluation for the vulnerable segments of the population. • If a significant portion of children of a representative population group is found to be both underweight and stunted and program managers identify lack of child-care practices to be the primary cause, nutrition interventions in the form of health education to the care-giver may be appropriate in a given situation. Nutrition & Child Health Status:Correlation
Data Requirement • Cross Sectional Data • Preferred approach as large representative samples and the information on a range of topics can be obtained in a short time period. • Cost-effective compared to long-term longitudinal studies. • Limitation: • Unlike longitudinal surveys, they do not support assessment of the direct effect of a particular episode of illness on nutritional status of the child - assessment of the impact of illness on growth attainment requires knowledge of individual growth trends, which cannot be determined from a single measurement. Nutrition & Child Health Status:Correlation
Data Requirement • Cross Sectional Data • Limitation: • Hence, cross-sectional measurements are unlikely to reflect a consistent relationship of nutritional status with reports of illness, whereas a series of measurements obtained at different points in time are very likely to demonstrate a direct causal relationship between episodes of illness, especially diarrhea. • Advantages: • Cross-sectional data to analyze the correlation of socioeconomic, demographic or environmental factors with nutritional status. Nutrition & Child Health Status:Correlation
Data description and methodology • Determinants of Nutritional outcome: • Socioeconomic indicators that affect child nutrition. • CARE indicators. • Community characteristics. • Outcome variables: • Anthropometric indicators: Z-scores of height for age (ZHA), weight for age (ZWA) and weight for height(ZWH). Nutrition & Child Health Status:Correlation
Data description and methodology • Socio-economic variables: • Per capita expenditure on food (PXFD): expenditure on food is a critical variable in models of child health and nutrition outcomes and is used as a proxy for income. • Education of the spouse (EDUCSPOUS): This is a categorical variable which has a value ranging from 1 to 7 and measures the education level of the mother in number of years. Higher values of this variable indicate greater levels of education. Nutrition & Child Health Status:Correlation
Data description and methodology • CARE indicators: • Clinic feeding (CLINFEED): a dichotomous variable denoting whether the child is fed in a clinic or not. • Breastfeeding (BFEEDNEW): also a dichotomous variable denoting whether the child is breastfed or not during his or her infanthood. Nutrition & Child Health Status:Correlation
Data description and methodology • Community characteristics: • Drinking distance (DRINKDST): a categorical variable assuming values from 1 to 5. Higher values of this variable denote that the distance to a protected drinking source for the household is higher. • For example, the variable attains a value of 4 if distance to a protected drinking source exceeds 3 km; greater the distance to a protected water source the more is the likelihood that children will suffer from malnutrition. This is because by reducing the risk of bacterial infections and diarrheal diseases, sanitation and clean water can indirectly contribute in improving a child’s nutritional status. Nutrition & Child Health Status:Correlation
Data description and methodology • Sanitation (LATERINE): a dichotomous variable assuming two values 0 and 1, with 0 indicating absence of latrine from the household. Sanitation appears more important in nutritional outcomes than presence of protected drinking source, since it is directly related in preventing diarrhea, thereby improving children’s nutritional status. Nutrition & Child Health Status:Correlation
Data description and methodology • DIARRHEA: Indicates whether the child has diarrhea and is a dichotomous variable assuming two values 0 and 1. 1 indicates that the child had diarrhea during the survey. Infections such as diarrhea can reduce the nutrients in the body and thus increase the likelihood of malnutrition further. Nutrition & Child Health Status:Correlation
Data description and methodology • Distance to a health facility (HEALTDST): a categorical variable denoting the distance of the household to a health clinic and assumes 4 values. Higher values indicate that the household is located farther from the nearest health center. For example, a value of 4 indicates that the distance to the nearest health clinic for the household is more than 10 km. Nutrition & Child Health Status:Correlation
Correlation Analysis Nutrition & Child Health Status:Correlation
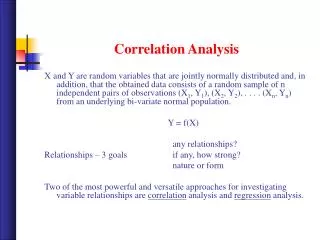
Paired Data Set • Issues: • Is there any relation? • If there is, what is it? • Can it be used for prediction? • Correlation is a measure of linear association between two variables. Nutrition & Child Health Status:Correlation
Positive Linear Association Nutrition & Child Health Status:Correlation
Negative Linear Association Nutrition & Child Health Status:Correlation
No Linear Association Nutrition & Child Health Status:Correlation
Correlation and Association • Correlation coefficient (r for sample statistics): • A measure of linear association: how far the sample observation on a pair of variables fall on a straight line. • Not a good summary measure of association if the scatter plot reveals non-linear patterns Nutrition & Child Health Status:Correlation
Concepts in correlation analysis • Suppose we have two random variables X and Y with means X and Y and standard deviations Sxand SYrespectively. • Then, the correlation coefficient can be computed as follows: The correlation coefficient measures the strength of a linear relationship between any two variables and is always between -1 and +1. The closer the correlation is to +1 or -1, the closer it is to a perfect relationship. Nutrition & Child Health Status:Correlation
Correlation and Association • r is not a good measure if the data are heteroscedastic. • r is not a good measure if there are outliers. • Strong correlation does not imply any cause-effect relation and vice versa. Nutrition & Child Health Status:Correlation
Football-shaped Scatter plots • A good summary of football-shaped scatter plots on variables X and Y: • Sample mean of X • Sample mean of Y • Standard deviation of X • Standard deviation of Y • And sample correlation coefficient Nutrition & Child Health Status:Correlation
r t = 1 – r 2 n – 2 Test Statistic t • Test Statistic Nutrition & Child Health Status:Correlation
Concepts in correlation analysis One can also express r in terms of the regression coefficients: Nutrition & Child Health Status:Correlation
Inference about population parameters in correlation Let us assume a situation in which we have a random sample of n units from a population with paired observations of X and Y for each unit. We want to test the null hypothesis that the population correlation coefficient ρ=0 against the alternative that ρ≠0. If the computed ρ values in successive samples from the population were distributed normally, we would have the standard error to perform the usual t-test involving the normal distribution. Thus, we have the following statistic: The standard error of r is given by Note that the hypothesis testing procedure is in terms of r instead of r2. Nutrition & Child Health Status:Correlation
Table 8.1 Frequency distribution of nutritional indicators Nutrition & Child Health Status:Correlation
Figure 8.1 Scatter plot of wasting with distance to a drinking water source Nutrition & Child Health Status:Correlation
Figure 8.2 Scatter plot of underweight with distance to a drinking water source Nutrition & Child Health Status:Correlation
Scatter Plots • Figure 8.1: Scatterplots (a geometric representation) of observations on incidence of wasting and distance to a protected water source. • Figure 8.2 : Underweight with distance to a protected water source. • Bivariate scatter plot: Display relationship between any two quantitative variables. • Both the incidences of wasting and underweight increase as the distance to the protected water source increases. • Could be due to increased risk of bacterial infections and diarrheal diseases as the household is located farther from a protected water source which, in turn, affects child nutrition adversely. Nutrition & Child Health Status:Correlation
Table 8.2 Pearson correlation coefficient among the various Z-scores Nutrition & Child Health Status:Correlation
Results • Stunting (defined as height for age Z-score below 2) and wasting (defined as weight for age Z-score below 2) are very weakly correlated at the 1 per cent level. • Stunting and wasting: Long-term and short-term indicators of the nutritional status of the child; hence, the low correlation would imply that the determinants of short term and long-term factors of nutrition are different. • Moderate correlation between weight for age (underweight) and stunting and weight for age and wasting would imply that significant monitoring and evaluation are required, since there is a higher likelihood that a significant proportion of children in Malawi (especially in the rural areas) may suffer from long-term malnutrition problems. Nutrition & Child Health Status:Correlation
Policy Imperatives 1. Improve the educational level (especially that of females). 2. Advocate better care practices (such as timely introduction of breastfeeding and other complementary feeding). 3. Improve sanitation facilities in communities where they are lacking, so as to prevent diseases such as diarrhea and other vector borne diseases. Nutrition & Child Health Status:Correlation