Download
1 / 12
120 likes | 245 Views
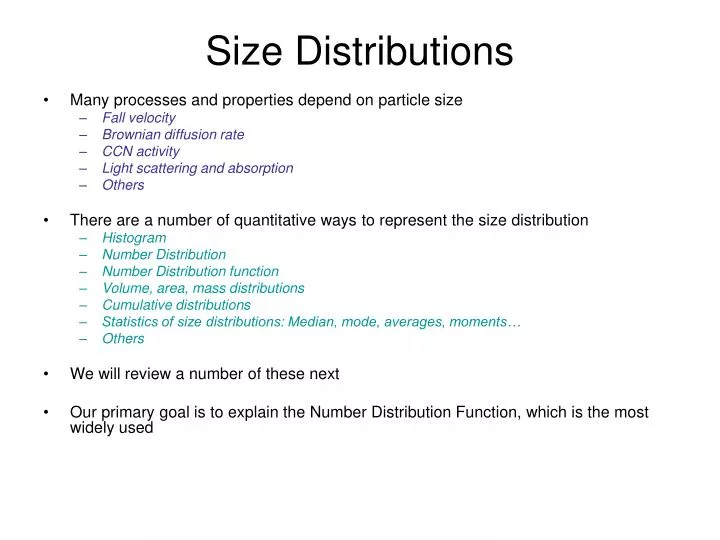
Size Distributions. Many processes and properties depend on particle size Fall velocity Brownian diffusion rate CCN activity Light scattering and absorption Others There are a number of quantitative ways to represent the size distribution Histogram Number Distribution

E N D
Size Distributions • Many processes and properties depend on particle size • Fall velocity • Brownian diffusion rate • CCN activity • Light scattering and absorption • Others • There are a number of quantitative ways to represent the size distribution • Histogram • Number Distribution • Number Distribution function • Volume, area, mass distributions • Cumulative distributions • Statistics of size distributions: Median, mode, averages, moments… • Others • We will review a number of these next • Our primary goal is to explain the Number Distribution Function, which is the most widely used
Size DistributionsThe Histogram Simplest form of distribution – Very instrument-based Lots of structure at small sizes Few particles at largest sizes Di –Di+1 Ni NB = Number of size bins Di = Lower-bound particle diameter for bin i Di+1 = Upper-bound particle diameter for bin i Ni = concentration of particles in bin i (cm-3)
Size DistributionsCumulative Properties from Histogram Total Concentration Total Surface Area Total Volume Total Mass Di –Di+1 Ni ri = density of aerosol substance in bin i Note: We don’t have an “average” diameter for the bin – only the bin boundaries. Above I use the geometric mean. Sometimes it makes sense to estimate where the particles are within the bin based on the concentrations of neighboring bins, and then calculate the effective mean diameter.
Size DistributionsCumulative Distributions Cum. Concentration Cum. Surface Area Cum. Volume Cum. Mass Di –Di+1 Ni • A Cumulative distribution gives the concentration (or some other property) of particles smaller than diameter Di • Cumulative values are properties at bin boundaries, not bin centers! • They are monotonically increasing in size • N(DNB+1) = Nt • Different instruments should report the same function, just sampled differently
Size DistributionsThe Number Distribution More uniform way to present instrument data Di –Di+1 Ni ni = aerosol number distribution for bin i DDi = Di+1–Diis the bin width Ni = niDDi ni = has units of (cm-3mm-1) Area under the curve = total aerosol concentration, N
Size DistributionsThe Number Distribution Histogram Number distribution Small bin width at small sizes leads to amplification of concentrations here relative to histogram Instruments with different Di would produce very different histograms, but similar number distributions
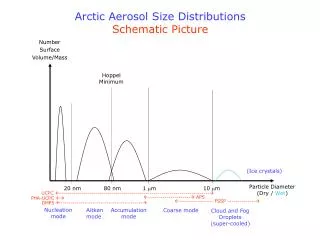
Size DistributionsThe Log Number Distribution Aerosol distributions span orders of magnitude in size, and are often best shown as a function of log-diameter. Now, the area under curve is NOT equal to total concentration. To remedy this, we can create a log number distribution (not shown above)
Size DistributionsThe Number Distribution Function Distributions are often represented in models or analytically, as continuous functions of diameter. This is as if we had an number distribution with perfectly precise resolution This looks a lot like the definition of the derivative. If we use the cumulative distribution, we get… We think of the number distribution function as the derivative with diameter of the cumulative distribution When n(D) is plotted vs. D (NOT logD), then the area under the curve = total concentration The log-diameter distribution is the derivative of the cumulative distribution with log of diameter
Size DistributionsOther Distribution Functions Number Distribution Surface Distribution Volume Distribution Mass Distribution Aerosol distributions span orders of magnitude in size, and are often best shown as a function of log-diameter. We must use the identity This lowers the power of Dn in the functions above. Note the “shifting of the peaks” from number area volume
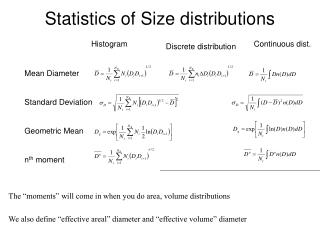
Statistics of Size distributions Histogram Continuous dist. Discrete distribution Mean Diameter Standard Deviation Geometric Mean nth moment The “moments” will come in when you do area, volume distributions
In-class… • Power-law distributions • Log-normal distributions • Properties of each