Download
1 / 12
120 likes | 221 Views
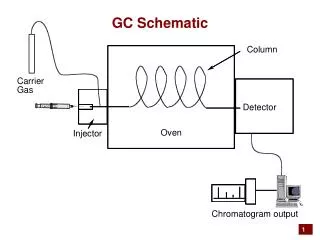
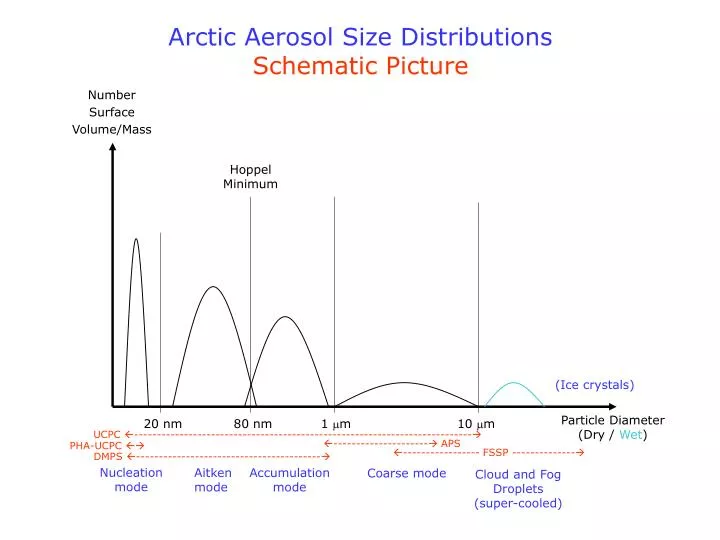
Arctic Aerosol Size Distributions Schematic Picture. Number Surface Volume/Mass. Hoppel Minimum. (Ice crystals). Particle Diameter (Dry / Wet ). 20 n m. 80 n m. 1 m. 10 m. UCPC --------------------------------------------------------------------------- .

E N D
Arctic Aerosol Size Distributions Schematic Picture Number Surface Volume/Mass Hoppel Minimum (Ice crystals) Particle Diameter (Dry / Wet) 20 nm 80 nm 1 m 10 m UCPC --------------------------------------------------------------------------- --------------------- APS PHA-UCPC ----------------- FSSP -------------- DMPS ----------------------------------------- Nucleation mode Aitken mode Accumulation mode Coarse mode Cloud and Fog Droplets (super-cooled)
Arctic Aerosols - Surface Sources Sea Spray Particles Wind motion Bubbles in sea water Bubbles bursting at surface Strong wind speed (U) dependence (exponential). Very little production for U < 5 ms-1. Jet drops mostly sea salt. Film drops contain also material from the surface microlayer. Number Film Drops Jet Drops 20 nm 80 nm 1 m 10 m Particle Diameter (Dry)
Arctic Aerosols - Surface Sources Particles from Biota/Surface Microlayer Sunny Bubble production Bubbles bursting through surface microlayer Conditions: Sunny, low wind speeds. Melting ice, freezing seawater, or sea water mixing brings bubbles to the surface. Surface microlayer scavenged by bubbles. Large bubbles More film drops Small bubbles More jet drops Number Angular shapes + organic ”glue” Viruses? Organic liquids with inclusions (film drops) Biota debris Bacteria 20 nm 80 nm 1 m 10 m Particle Diameter (Dry)
Arctic Aerosols – Atmospheric Sources Particles from Homogeneous Nucleation (OH+NOx) (OH) (NH3+H2O) DMS(aq) DMS(g) SO2(g) H2SO4(g) Nucleation • Requirements: • - Sulphuric acid • - Ammonia (from sea) • - Water vapour • Favourable conditions: • - Sunny (OH production) • Humid • Low temperature • Turbulence Number Critical cluster size 1 nm. Grows by condensation to observable sizes (3 nm). 20 nm 80 nm 1 m 10 m Particle Diameter (Dry)
Arctic Aerosols – Atmospheric Sources Drying of fog droplets (L-methionine hypothesis) Fog evaporation Release of L-Methionine dimers Nucleation Simultaneous appearance of Aitken-sized particles • Favourable conditions: • Clearing of fog • Sunny (bubble production) Number L-methionine dimers Angular shapes Viruses? 20 nm 80 nm 1 m 10 m Particle Diameter (Dry)
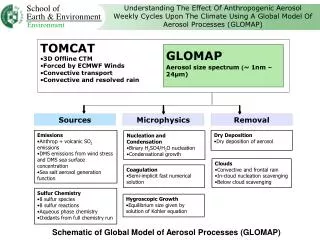
Processes affecting the Atmospheric Aerosol Raes et al. Atm. Env. 34(2000)4215
Arctic Aerosol Size Distributions Processes Reshaping the Size Distribution • Condensable vapours: • Sulphuric acid (DMS-derived) • Ammonia • Organics Number Surface Volume/Mass Hoppel Minimum Condensation Coagulation - Activation to cloud droplets - In-cloud processing ------------ Wet deposition ---------------------- Dry deposition (Ice crystals) 20 nm 80 nm 1 m 10 m Particle Diameter (Dry / Wet) Nucleation mode Aitken mode Accumulation mode Coarse mode Cloud and Fog Droplets (super-cooled)
Atmospheric Aerosol Processes Effect on Concentrations Particle Number Surface Microlayer Homogeneous Nucleation Primary Emissions Original Concentrations Sea Spray Dry Deposition Condensation Coagulation Wet Deposition Particle Mass
Overview of the model Overwiew of CCN Prediction Model DMPS Differential Mobility Particle Size Inverted Size distribution CCN H-TDMA Hygroscopic Tandem Differential Mobility Analyzer e Soluble volume fraction Ni Number of soluble ions as a function of particle size Sc Critical super- saturation as function of particle size dact Activation (dry) diameter for a specific supersaturation
Köhler Curve Classical Köhler theory: Critical saturation ratio
CCN Calculations Classical Köhler theory: Critical saturation ratio or: Where Sc is the saturation ratio and and Finding the critical super saturation through derivation gives: Where is the supersaturation Sc-1=sc or:
Example of CCN Spectrum Supersaturations in Arctic stratocumulus clouds typically active the entire accumulation mode. Typical Sc supersaturation