Download
1 / 21
210 likes | 306 Views
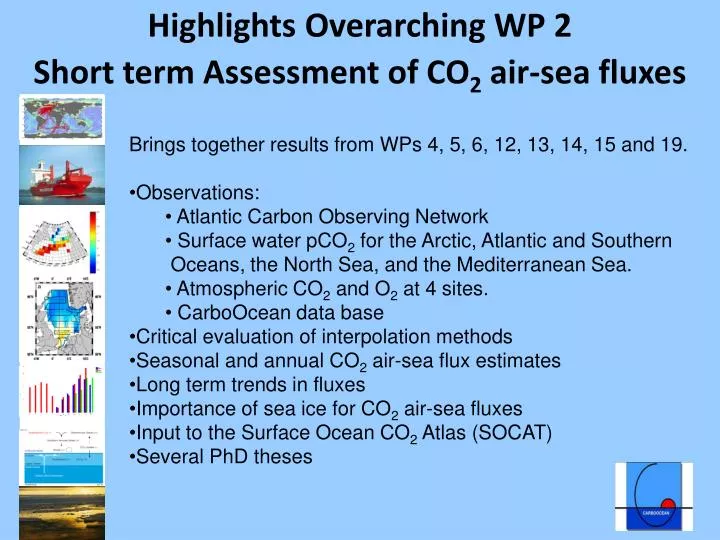
Highlights Overarching WP 2 Short term Assessment of CO 2 air-sea fluxes. Brings together results from WPs 4, 5, 6, 12, 13, 14, 15 and 19. Observations: Atlantic Carbon Observing Network Surface water pCO 2 for the Arctic, Atlantic and Southern

E N D
Highlights Overarching WP 2Short term Assessment of CO2 air-sea fluxes • Brings together results from WPs 4, 5, 6, 12, 13, 14, 15 and 19. • Observations: • Atlantic Carbon Observing Network • Surface water pCO2 for the Arctic, Atlantic and Southern • Oceans, the North Sea, and the Mediterranean Sea. • Atmospheric CO2 and O2 at 4 sites. • CarboOcean data base • Critical evaluation of interpolation methods • Seasonal and annual CO2 air-sea flux estimates • Long term trends in fluxes • Importance of sea ice for CO2 air-sea fluxes • Input to the Surface Ocean CO2 Atlas (SOCAT) • Several PhD theses
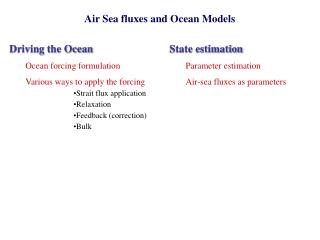
CO2 air-sea flux = K • (fCO2water - fCO2air) turbulence temperature, (temperature) biology, mixing, circulation. wind speed, sea state fCO2 = γ x pCO2 (@Assmy – AWI; Young - Natural History Museum)
Importance of good data coverage& Input to global flux climatology (Pg C /yr) Global oceans (1990s, 2000-05)0 2.2±0.5 (0.94M pCO2 data)1 1.65 (3.0M pCO2 data)1 1.42 South of 50°S (0.94 M pCO2 data)1 0.4 (3.0 M pCO2 data)1 0.06 (Takahashi et al., 2009) • High pCO2 at ice edge (Takahashi et al., 2009) Pg = 1015 g (0Denman et al., 2007; 1Takahashi et al., 2009)
An Atlantic carbon observing network Started 2002 (CAVASSOO), operational 2005 onwards
Data collected during • CarboOcean, e.g.: • Atlantic Observing System • Southern Ocean (ships & buoys) CarboOcean data base: Storage of surface water fCO2 ALL data submitted by the CarboOcean PIs @ Benjamin Pfeil, CarboOcean data manager
Monthly surface water pCO2 for 2004, 2005 & 2006 • Interpolation of surface water pCO2 measurements with a neural network approach. • First monthly pCO2 maps for the North Atlantic Ocean • Flux maps have been created from the pCO2 maps. Telszewski et al., 2009. BG 6: 1405-1421.
Long-term changes in North Atlantic CO2 air-sea fluxes Change in the annual mean sea-air flux from 1990 to 2006 (mol m-2 yr-1) • A decrease in oceanic CO2 uptake for the northern North Atlantic (negative values). • Little change in the CO2 sink in the western subtropical Atlantic. (Schuster et al., 2009. DSR II 56: 620-629)
Correlation of CO2 air-sea fluxes with the North Atlantic Oscillation (NAO) • Strong correlation between CO2 air-sea flux and NAO for a 1-3 year lag. • The NAO-response of CO2 fluxes in different regions may be opposite. • Large decadal variation of the North Atlantic CO2 flux. • (Raynaud et al., 2006; Ocean Science 2: 43-60) • NAO+ (e.g. 1989-1995) • Strong winds • Strong North Atlantic Current and Labrador Current • More saline subtropical water reaches the eastern subpolar gyre and the polar seas. • Strong MOC in the Labrador Sea • Strong CO2 sink by strong NAC in northeastern North Atlantic • (Thomas et al., 2008; GBC 22: GB4027) (45-60N, W of 30W) (>60N)
Seasonal & interannual pCO2 changes in the North Sea ΔpCO2 (water-air) (µatm) North-South transect • The North Sea is an annual CO2 sink • Large interannual variation in CO2 air-sea fluxes. Omar et al. (2009) Ocean Science Discussions 6: 1655-1686.
Multi-annual variation in North Sea ΔpCO2 ΔpCO2 in 08/2005 Change in ΔpCO2 • ΔpCO2(w-a) increased (less negative) in August • for 2001- 2005. • (Thomas et al., 2007. GBC 21: GB4001)
Contribution to a revised mass balance of carbon on the continental shelves Continental shelves act as sinks of 0.33-0.36 Pg C yr-1. Near-shore ecosystems act as sources of ~0.50 Pg C yr-1. (Chen and Borges, 2009)
Two tropical time-series stations • at 6°S, 10°W since June 2006 • at 8°N, 38°W since April 2008 • hourly measurements of surface fCO2 Monthly CO2 flux at 6oS, 10oW • Oceanic source of CO2 throughout the year. • Seasonal & interannual variation of flux (Lefèvre et al.)
Monitoring fCO2 with CARIOCA drifters 6 SAF PF sourcenk oceanic sink fCO2(water -air) (µatm) • Ocean CO2 sinks of • 0.8 Pg C yr-1 in the Subantarctic Zone • <0.1 Pg C yr-1 in the Polar Zone • from CARIOCA data since 2001. • Boutin et al. (2008) L&O 53: 2062-2079.
A reduction in CO2 uptake in the Southern Ocean? Annual increase of surface water fCO2 for 1991 to 2007 in the SW Indian Ocean Atmospheric fCO2 The overall trend of 2.11 (±0.07) µatm yr-1 suggests that surface water fCO2 increased faster than atmospheric fCO2 by about 0.4 µatm yr-1. Metzl, 2009, DSR II 56:607-619. Also Le Quéré et al., 2007. Science 316:1735-1738.
A decrease in ozone (O3) may reduce Southern Ocean CO2 uptake by strengthening the winds Lenton et al., GRL, 2009: GRL 36: LI2606
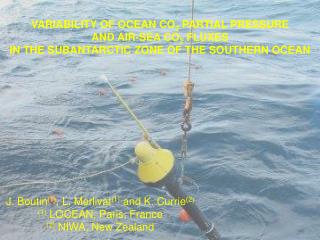
Importance of sea ice for CO2 air-sea fluxes (Arctic & Southern Ocean) 08-10/12/2004 20/12/2004 Sea ice coverage Brown ice, 17-20/12/02 (%) Below ice: fCO2(w-a) 0 to 40 µatm Upon melt: fCO2(w-a) -50 to 0 µatm Biological carbon uptake rapidly creates a CO2 sink during and upon ice melt in the Weddell Sea. 17/12/2004 0°W Surface fCO2 decrease during ice melt Bakker et al. (2008) BG 5: 1373-1386; also Anderson et al. (in press) GRL.
Input to SOCAT (Surface Ocean CO2Atlas) • Initiated in 2007 by IOCCP, SOLAS, IMBER; http://www.ioccp.org/ • Aims: • 2nd level quality controlled (QC) global surface ocean fCO2 data set • Gridded global SOCAT product of monthly surface water fCO2 means, with no temporal or spatial interpolation (i.e. bin averages). • The data products will be made publicly available.
Input to SOCAT (Surface Ocean CO2 Atlas) • Public fCO2 data in common format (Pfeil, Olsen, UoB). • Life Access Server for data access (Hankin, Malzcyk, PMEL). • 2nd level QC by regional groups (coastal, Pacific, Atlantic, Indian, Southern Oceans). • SOCAT product release (mid 2010) • SOCAT data synthesis & scientific articles • Joint SOCAT & ocean interior science meeting, spring 2011. • SOCAT synthesis & output for IPCC AR5? (spring 2011) • SOCAT input to RECCAP? (RECCAP synthesis by 03/2011).
Highlights Overarching WP 2Short term Assessment of CO2 air-sea fluxes • Brings together results from WPs 4, 5, 6, 12, 13, 14, 15 and 19. • Observations: • Atlantic Carbon Observing Network • Surface water pCO2 for the Arctic, Atlantic and Southern • Oceans, the North Sea, and the Mediterranean Sea. • Atmospheric CO2 and O2 at 4 sites. • CarboOcean data base • Critical evaluation of interpolation methods • Seasonal and annual CO2 air-sea flux estimates • Long term trends in fluxes • Importance of sea ice for CO2 air-sea fluxes • Input to the Surface Ocean CO2 Atlas (SOCAT) • Several PhD theses.
Data collected during • CarboOcean, e.g.: • Atlantic Observing System • Southern Ocean (ships & buoys) Surface water fCO2 data collection and storage • Historic data submitted by PIs from the: • Nordic Seas • North Sea • Atlantic Ocean • Southern Ocean @ Benjamin Pfeil, CarboOcean data manager