Download
1 / 16
160 likes | 257 Views
Global trends in air-sea CO 2 fluxes based on in situ and satellite products. Rik Wanninkhof, NOAA/AOML ACE Ocean Productivity and Carbon Cycle (OPCC) Workshop - June 6-8,UC Santa Barbara. Sea surface temperature (SST). Wind speed. [Atlas et al., 2011]. CCMP

E N D
Global trends in air-sea CO2 fluxes based on in situ and satellite products Rik Wanninkhof, NOAA/AOML ACE Ocean Productivity and Carbon Cycle (OPCC) Workshop - June 6-8,UC Santa Barbara
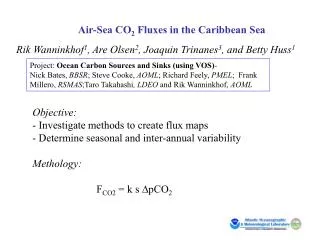
Sea surface temperature (SST) Wind speed [Atlas et al., 2011] CCMP (Cross-Calibrated Multi-Platform wind product) OPCCGlobal Ocean Sea-Air CO2 Fluxes Methods: Sea-air CO2 Flux = K0 × k × ΔpCO2 k660 = 0.251 <u2> ΔpCO2 climatology [Takahashi et al., 2009]
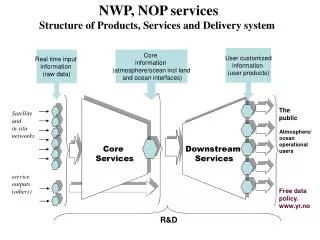
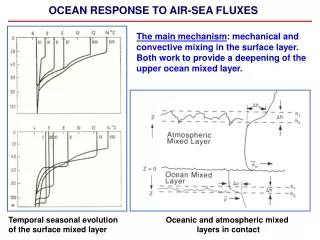
OPCCGlobal Ocean Sea-Air CO2 Fluxes Factors influencing CO2 flux estimates Wind Wind Waves Biology Surface Film Bubbles k DpCO2 SST Near Surface Turbulence Transport Air-Sea CO2Flux Bock et al. (1999)
OPCCGlobal Ocean Sea-Air CO2 Fluxes Data coverage T-09 climatology
OPCCGlobal Ocean Sea-Air CO2 Fluxes Surface Ocean Carbon Atlas (SOCAT) A Multi-national Effort: England USA France Netherlands Germany Spain China Japan Tasmania Norway And more… Complete Data Set: 1968–2008 10M points Our contribution: 3M points
OPCC Global Ocean Sea-Air CO2 Fluxes Remote sensing Wind: CCMP 6-hr ¼˚ Gas transfer velocity k660 = 0.251 <u2> based on global 14C constraint
OPCC Global Ocean Sea-Air CO2 Fluxes Global 14C constraint Bomb 14C inventory constraint Globally: a <u2> = Constant Semi-infinite Half space Broecker and Peng (1994) Transfer velocity kav= 17.5 cm/hr u2 = 69.3 (m/s) 2 umean ≈ 7.4 m/s
OPCC Global Ocean Sea-Air CO2 Fluxes Relationship of k and U10 Good agreement with global bomb 14C constraint and local studies Ho et al. 2011
OPPCSea-Air CO2 Fluxes Climatological Magnitude and Uncertainty Uncertainty in different components of the flux estimate (adapted from section 6, T-09) Takahashi et al. (2009) RECCAP (2011) Pg C yr-1 % Pg C yr-1 % Pg C yr-1 Net flux -1.4 -1.2 ∆pCO2 ±0.18 ±13% ±0.18 k ±0.42 ± 30% ±0.2 Wind (U) ±0.28 ± 20% ±0.2 <pCO2w/dt>a ±0.5 ± 35% ±0.5 Total ±0.7 ± 53%. ±0.6 Under-sampling bias -0.2 -0.2 Pre-industrial sea-air flux 0.4 ± 0.2 0.4 ± 0.2 Anthropogenic CO2 flux -2.0 ± 1.0 -1.8 ± 0.8
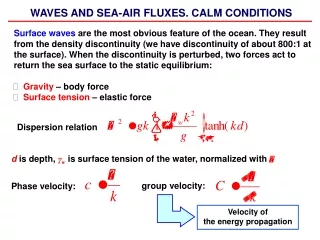
OPCC Global Ocean Sea-Air CO2 Fluxes Factors influencing surface water pCO2 Variable Range Relation Effect Temperature (C) -2 –30 (ln pCO2/T) = 0.0423oC-1 400% TCO2(mmol kg-1) 1900-2200 (ln pCO2/Tln TCO2) = 10 400% Salinity(mmol kg-1)* 33.5-37 (ln pCO2/Tln S) = 0.94 ~10% Alkalinity(mmol kg-1)* 2150-2350 (ln pCO2/Tln TALK) = -9.4 -200% *Alkalinity and salinity are proportional and can be accounted for
OPPCSea-Air CO2 Fluxes: Model and atm. based estimates of trends Annual uptake of anthropogenic CO2 since 1960 from models. The absolute uptake (solid line, left axis) has increased over time while the fraction of uptake (=ocean uptake/fossil fuel CO2 release *100) (dashed line, right axis) has decreased. Data are obtained from http://lgmacweb.env.uea.ac.uk/lequere/co2/carbon_budget.htm (Le Quéré et al., 2009).
OPCCSea-Air CO2: Flux variability Trends Fym = kym K0 ym {[ΔpCO2 2000m + (δpCO2SW / δSST)2000m × ΔSSTym – 2000m] }, (δpCO2SW / δSST)2000m : Optimal subannual relationships for each 4˚ by 5˚ grid box Park et al. Tellus B 2010:Variability of global net sea-air CO2 fluxes over the last three decades using empirical relationships
OPCCSea-Air CO2 Fluxes Trends 1980-1999 Sea-air CO2 Flux = K0 × k × ΔpCO2 The linear regressions (solid line) for the flux are 0.009± 0.005 Pg C yr-1, respectively. The 20-years mean values for the flux is -1.12± 0.13 Pg C, respectively. Decrease in uptake due to winds and SST feedbacks
OPCC Global Ocean Sea-Air CO2 Fluxes Remote sensing How can we quantify the impact of [remotely measured] biological processes on ∆pCO2? • Regional approach • Multi-sensor • Melding in situ and remotely sensed information
OPCCSea-Air CO2 Fluxes: IPCC estimates Annual uptake of anthropogenic CO2 since 1960 from models. The absolute uptake (solid line, left axis) has increased over time while the fraction of uptake (=ocean uptake/fossil fuel CO2 release *100) (dashed line, right axis) has decreased. Data are obtained from http://lgmacweb.env.uea.ac.uk/lequere/co2/carbon_budget.htm (Le Quéré et al., 2009).
OPCCSea-Air CO2: Global Winds Figure 4. Zonal wind comparison of several global wind products for the year 2000. The differences of up to 2 m/s are observed but the biases are not always consistent between high and low latitudes. (Figure courtesy of C. Sweeney) .CCMP = Cross Calibrated Multi-Platform winds (Atlas et al., 2011); ECWMF =European Center for Medium Weather Forecasting; NCEP = National Center for Environmental Prediction; QSCAT = QuikSCAT polar orbiting satellite with an 1800 km wide measurement swath on the earth's surface equipped with the microwave scatterometer SeaWinds