Download
1 / 21
210 likes | 335 Views
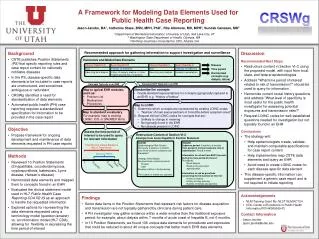
The TBEST Framework for Data Analysis and Forecasting Rodney P. Bunner October 16, 2013 l Public Transit Modeling. Agenda. Motivation and Use GIS Specifications TBEST Framework Components Data Management Data Interoperability Data Requirements Model Engine Analysis and Reports

E N D
The TBEST Framework for Data Analysis and Forecasting Rodney P. Bunner October 16, 2013 l Public Transit Modeling
Agenda • Motivation and Use • GIS Specifications • TBEST Framework Components • Data Management • Data Interoperability • Data Requirements • Model Engine • Analysis and Reports • Next Steps
Motivation • FDOT/planners wanted a software tool for short-term transit service planning – designed specifically for transit. • Serve as FDOT provided ridership estimation technique for State mandated Transit Development Plans (TDPs) • Transit Boardings Estimation and Simulation Tool (TBEST) has been in production for several years and is on its 4thMajor Version (4.1). • FDOT is continually supporting the improvement of TBEST.
TBEST in Florida • Major Benefits: • Standardized modeling method to ensure consistency and equity among agencies • TBEST reduces burden on FDOT for evaluating a variety of ridership estimation methodologies • TBEST reduces burden on agencies to prepare and conduct more expensive and complex modeling efforts • Leverage TBEST data and software framework to support multiple transit agency tasks: • Service Planning • Comprehensive Operational Analysis (COA) • Grant Applications • FTA Title VI Analysis • Mobility Studies • NTD Route Miles • Market Analysis • Network Accessibility
TBEST Elsewhere Various projects inside and outside of Florida: • RVTD (Oregon) Calibration and Implementation • Los Angeles Metro Calibration • CAT (Savannah) Strategic Plan • TheT (Ft. Worth) Model Development • LYNX (Orlando) Service Planning Implementation • PennDOT Pilot Project • PeopleMover (Anchorage, AK)
TBEST GIS Specifications • Desktop application requiring ArcGIS 10.1 Basic license • Utilizes ArcGIS Engine for map display, spatial analysis and network editing • SQL Server 2008 R2 (Express or Enterprise editions) • No Network Analyst or ArcSDE required • Utilizes ESRI Map Services, Bing Maps or preformatted .mxd for base map • No fee for TBEST except ArcGIS license
Components – Data Management • TBEST manages data specific to individual transit systems • Each transit system is composed of scenarios which contain editable routes, segments, stops, socio-economic data and network attributes • Validation specific to each transit system • All GIS/database files managed internally • Download pre-formatted SE data, transit systems and model definition packages • Easily create current or future year scenarios TBEST managed Transit Systems
Components – Data Management TBEST User Interface
Components – Data Interoperability GTFS Import • Imported networks for FL agencies with GTFS feeds • Utilized nationally in Ft. Worth, RVTD, Los Angeles, Savannah GTFS Export • Export TBEST “planning” network into GTFS • Added TBEST attributes to exported data including ridership and stop amenities ArcGIS • Export TBEST maps and data into ArcGIS • Import route alignments into TBEST from outside data sources • Export “loaded networks” into geodatabases
Components – Data Requirements Original Data Requirements • Census 2000 • Employment • FDOT provided InfoUSA address-based data • Manually coded Route Network • Special Generator Specification Current Data Requirements • Census 2010 • American Community Survey • Employment • FDOT provided InfoUSA address-based data • Optionally include locally provided zonal data • Land Use • Florida Department of Revenue parcel data • ITE Trip Generation Tables • GTFS network import and full network editor • Special Generator and Stop Amenity Specification
Components – Model Engine • Micro-level model which simulates transit ridership at the level of the individual stop: by route, direction and time period • Designed to capture both walk access market and network accessibility • Model equations estimate direct and transferboardings • Accommodate service features of fare, speed, frequency, etc. • Accommodate fundamental differences in route types (local, circulator, express) • Automated Validation – Users supply observed ridership and TBEST calculates model application adjustments…allows TBEST to adapt to different urban locations without developing new model equations (transferable)
Components – Model Engine Multiple Model Management Users are able to maintain multiple model structures which can be applied to model scenarios Editable Model Structures Users can add, delete or modify coefficients, land use trip rates, and network and market accessibility parameters Available Models
Components – Model Engine BRT Sensitivity - Users specify the implementation level of specific route-level BRT characteristics and TBEST will adjust base ridership forecasts with an empirically derived adjustment factor
Components – Analysis and Reports Stop, Segment, Route and Regional distribution reports with supporting maps
Components – Analysis and Reports Scenario Comparison and Mobility Threshold service recommendations
Components – Analysis and Reports TDP Summary Report - Summarizes annual service area pop, employment, performance, and service for all scenarios in a TBEST transit system
Components – Analysis and Reports Land Use Market Analysis
Components – Analysis and Reports Socio-Economic Market Analysis
Components – Analysis and Reports Network Accessibility Analysis
Steps Underway October 2013 • Release TBEST 4.1 • Contains online Video Tutorials • Classroom training early 2014 January 2014 • Enhanced FTA Title VI and Environmental Justice Analysis and Reporting June 2014 • Parcel Editor • Integrate Observed Ridership for COA support October 2014 • Network Accessibility Composite Measures
Contact Information Thank You! www.tbest.org Xuehao Chu, Ph.D. Senior Research Associate xchu@cutr.usf.edu 813-974-9831 Rodney Bunner Transportation Technology Specialist rbunner@cutr.usf.edu rodbunner@hotmail.com Steven Polzin, Ph.D. Director Mobility Policy Research polzin@cutr.usf.edu. 813-974-9849