Download
1 / 25
250 likes | 370 Views
September 17, 2013. The TBEST Framework for Data Analysis and Forecasting. Center for Urban Transportation Research | University of South Florida. TBEST. Transit Demand Modeling/Analysis Software developed by

E N D
September 17, 2013 The TBEST Framework for Data Analysis and Forecasting Center for Urban Transportation Research | University of South Florida
TBEST Transit Demand Modeling/Analysis Software developed by the Florida Department of Transportation Office of Freight, Logistics and Passenger Operations FDOT Goal Provide a “Comprehensive Transit Network Modeling, Management and Analysis Software with a focus on short to mid-term transit planning available to all Florida transit agencies” Support Agency Transit Development Plans (TDP): TBEST is an FDOT approved ridership estimation methodology
TBEST Utilization Provide workflow support for the following: • Service Planning • Comprehensive Operational Analysis (COA) • Grant Applications • FTA Title VI Analysis • Mobility Studies • NTD Route Miles • Market Analysis • Network Accessibility Transit Planning/Forecasting Software
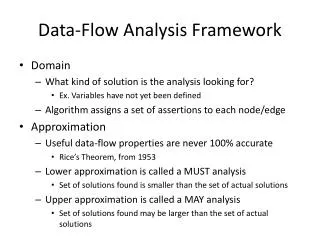
Framework Components • Model Development • Application • Analysis • Reporting and Output
Managing Components TBEST Transit System • Composed of model scenarios which contain editable routes, stops, socio-economic data and network attributes • All GIS/database files managed internally • Download pre-formatted SE data • Managed Model Validation • Customizable model structure • Easily create current or future year scenarios
TBEST GIS Specifications • Desktop application requiring ArcGIS 10.1 Basic license • Utilizes ArcGIS Engine for map display, spatial analysis and network editing • ESRI personal geodatabase stores transit layers and socio-economic data geometry • Demographics, service characteristics, and model output stored in SQL Server 2008 R2 (Express or Enterprise editions) • No Network Analyst or ArcSDE required • Utilizes ESRI Map Services, Bing Maps or preformatted .mxd for base map • No fee for TBEST except ArcGIS license
Model Specifications • Micro-level model which simulates transit ridership at the level of the individual stop: by route, direction and time period • Designed to capture both walk market and network accessibility • Model equations estimate direct and transferboardings • Accommodate service features of fare, speed, frequency, etc. • Accommodate fundamental differences in route types (local, circulator, express) • Model validation process allows TBEST to adapt to different urban locations without developing new model equations (transferable)
Model Equations Users are able to maintain multiple model structures which can be applied to model scenarios TBEST is installed with two model structures, the classic TBEST Model which utilizes the Census and Employment data and the new TBEST Land Use Model which includes trip-generation from parcel land use data. New models coming online in Los Angeles and Oregon • LA model will include specific equations for Bus and Rail • Oregon model will include customization of the parcel level land use model Available Models
BRT Sensitivity TBEST now supports BRT route definition and model sensitivity How it works Users specify the implementation level of specific route-level BRT characteristics and TBEST will adjust base ridership forecasts with an empirically derived adjustment factor
Network Interoperability • GTFS Import • Imported networks for all FL agencies with GTFS feeds • Also used nationally in Ft. Worth, Portland, Los Angeles, Savannah • GTFS Export • Export TBEST network into GTFS • Added TBEST attributes to exported data including ridership and stop amenities • ArcGIS • Export TBEST maps and data into ArcGIS • Import route alignments into TBEST from outside data sources • Export “loaded networks” into geodatabases
Scenario Modifications Service Supply Adjustments Demand Adjustments
Model Reporting • Stop, Segment, Route and Regional distribution reports with supporting maps
Model Reporting • Scenario Comparison and Mobility Threshold service recommendations
Model Reporting • TDP Summary Report • Summarizes annual service area pop, employment, performance, and service for all scenarios in a TBEST transit system
Market Analysis • Works to summarize the intensity and distribution of land use, socio-economic, and employment data for a given transit market in a current year or future year socio-economic setting • Performed on existing or proposed network structure or within specific DRI’s/corridors to determine the viability of transit options in the area • Independent of the TBEST modeling capabilities
Market Analysis Land Use Market Analysis
Market Analysis Socio-Economic Market Analysis
Market Analysis FTA Title VI Analysis
Network Accessibility Analysis • Combines TBEST transit networking origin/destination capabilities with market and model results to produce an interactive summarization of network accessible markets and model output • Network Accessibility Build - core of the accessibility calculation which populates an origin/destination matrix for each stop in the network • Summarizes both outflow and inflow markets and ridership from a selected stop, multiple stops or from a geographic area by time of day • Filter results by trip time and number of transfers
Network Accessibility Analysis Network Accessible Market Analysis
Implementation Results Win-Win-Win Situation FDOT standardized model platform for consistent TDP ridership reporting across agencies Agencies have a pre-built methodology for estimating ridership + multiple workflow support Consultantsusing TBEST for TDP, COA, etc.have an easy-to-implement ridership estimation solution with available data, tools and modeling capabilities
Steps Underway September 2013 • Release TBEST 4.1 • Contains online Video Tutorials • Classroom training early 2014 January 2014 • Enhanced FTA Title VI and Environmental Justice Analysis and Reporting June 2014 • Parcel Editor • Integrate Observed Ridership for COA support October 2014 • Network Accessibility Composite Measures
Contact Information Rodney Bunner Transportation Technology Specialist rbunner@cutr.usf.edu rodbunner@hotmail.com 727-455-4059 Gabrielle Matthews FDOT Project Manager Gabrielle.Matthews@dot.state.fl.us 850-414-4532 Thank You! www.tbest.org