Download
1 / 15
160 likes | 338 Views
Diffentiating GMOs From Non-GMOS. Troy G. Schmitz Assistant Professor Morrison School of Agribusiness Charles B. Moss Andrew Schmitz Presented at: Free Trade: Responding to Opportunities and Challenges San Antonio, Texas May 24, 2002. Topics for Discussion.

E N D
Diffentiating GMOs From Non-GMOS Troy G. Schmitz Assistant Professor Morrison School of Agribusiness Charles B. Moss Andrew Schmitz Presented at: Free Trade: Responding to Opportunities and Challenges San Antonio, Texas May 24, 2002
Topics for Discussion • Show the conditions under which two separate markets can emerge: one for GMOs and one for non-GMOs • Show why that in cases where the markets can be separated there will be a price premium for Non-GMOs • Discuss why most non-GM corn is not marketed as such • Discuss why the rate of adoption for GM corn is low and declining • Show that when IP costs are added to deal with market segregation problems, total revenue to all corn producers declines • Show Preliminary Trade Model for Food vs. Non-Food Corn with IP Costs added
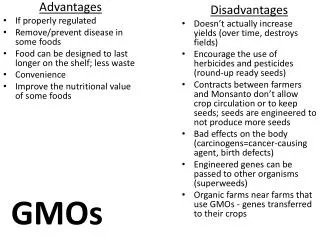
Additional Transaction Costs for non-GMO Producers • Non-GM corn can be used to satisfy BOTH the non-GM and GM markets. • GM Corn can be sold only in markets that do not differentiate • Non-GM corn and soybeans must be tested in order for the producer to receive a price premium in the non-GM market • Additional transaction costs exist when selling to the non-GM market: • (1) Cleaning Costs • (2) Planting barriers (safety strips or male plants) • (3) Costs of removing volunteer plants from previous crops • (4) Several costs associated with Identity Preservation through the channel • Any premiums that may exist for non-GM certified grain MUST account for: • (1) All the deterministic costs mentioned above; AND • (2) The probability that the crop could become contaminated anyway
Survey Responses by Ohio Farmers Related to Segregation and Market Premiums (GM versus non-GM adoption)
IP Costs and Product Differentiation *Elasticity of Residual non-Food Demand = -0.5 **100 percent of food corn use is made up of non-GM corn)
Impact of IP Costs on GM and Non-GM U.S. Corn Prices IP Costs $0.29 per bushel Residual Demand Residual Demand Elasticity –0.5*Elasticity –1.2 Percent of Food Percent of Food Demand GMO-Free Demand GMO-Free100 50 100 50 Corn Price before IP Costs ($/bushel) 1.85 1.85 1.85 1.85 Price of Non-GM Corn: IP Costs ($0.29/bushel) 2.06 2.10 2.10 2.12 Non-GMO Price Received by Farmers ($/bushel) 1.77 1.81 1.81 1.83 Non-GM Corn before IP Costs (billion bushel) 2.45 1.23 2.45 1.23 Reduction in GMO Uses due to IP Costs (billion bushel) -0.14 -0.08 -0.17 -0.09 Non-GM Corn after IP Costs (billion bushel) 2.31 1.14 2.28 1.14 Change in Undifferentiated Corn Price due to IP Costs ($/bu) -0.08 -0.04 -0.04 -0.02 Price of Undifferentiated Corn after Additional IP Costs ($/bu) 1.77 1.81 1.81 1.83 Total Revenue before IP Costs (billion $) 17.45 17.45 17.45 17.45 Total Revenue after IP Costs (billion $) 16.74 17.09 17.10 17.29 Change in Total Revenue (billion $) -0.71 -0.36 -0.35 -0.16 Total IP Costs (billion $) 0.67 0.33 0.66 0.33 *The elasticity of food demand is held constant at –0.5.
Impact of IP Costs on GM and Non-GM U.S. Corn Prices IP Costs $0.58 per bushel Residual Demand Residual Demand Elasticity –0.5*Elasticity –1.2 Percent of Food Percent of Food Demand GMO-Free Demand GMO-Free100 50 100 50 Corn Price before IP Costs ($/bushel) 1.85 1.85 1.85 1.85 Price of Non-GM Corn: IP Costs ($0.58/bushel) 2.28 2.35 2.36 2.40 Non-GMO Price Received by Farmers ($/bushel) 1.70 1.77 1.78 1.82 Non-GM Corn before IP Costs (billion bushel) 2.45 1.23 2.45 1.23 Reduction in GMO Uses due to IP Costs (billion bushel) -0.28 -0.17 -0.34 -0.18 Non-GM Corn after IP Costs (billion bushel) 2.17 1.06 2.12 1.05 Change in Undifferentiated Corn Price due to IP Costs ($/bu) -0.15 -0.08 -0.07 -0.03 Price of Undifferentiated Corn after Additional IP Costs ($/bu) 1.70 1.77 1.78 1.82 Total Revenue before IP Costs (billion $) 17.45 17.45 17.45 17.45 Total Revenue after IP Costs (billion $) 16.03 16.74 16.75 17.13 Change in Total Revenue (billion $) -1.42 -0.71 -0.70 -0.32 Total IP Costs (billion $) 1.26 0.61 1.23 0.61 *The elasticity of food demand is held constant at –0.5.
Conclusions • The fact that consumers differentiate between GM and non-GM product is insufficient to generate a price premium for non-GM output. • If there is an excess supply of non-GM output, even in the presence of IP costs, a price differential will not emerge at the farm level. • However, if there is an excess demand for non-GM output, a price premium will be realized at the farm level. • In reality, 75% of corn planted in the U.S. is non-GM. • The demand for non-GM is much less than 75% of all corn, even when you combine domestic food consumption and exports for food uses. • Premiums for U.S. corn producers for non-GM corn are hard to find (at the farm level). • At current IP cost levels, regardless of the type of corn grown, U.S. farmers are made worse off due to the introduction of GM corn.