Download
1 / 13
130 likes | 202 Views
Graphing Linear Equations. Using slope and y-intercept Using slope and any point on the line. IML 2011. IML 2011. IML 2011. IML 2011. IML 2011. IML 2011. IML 2011. IML 2011. Graph the linear equation which contains the point (4, 2) and has a slope of -3. IML 2011.

E N D
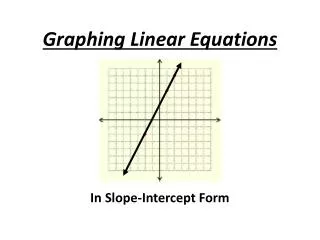
Graphing Linear Equations Using slope and y-intercept Using slope and any point on the line IML 2011
Graph the linear equation which contains the point (4, 2) and has a slope of -3. IML 2011
Graph the linear equation which contains the point (4, 2) and has a slope of -3. IML 2011
Graph the linear equation which contains the point (4, 2) and has a slope of -3. IML 2011
Graph the linear equation which contains the point (4, 2) and has a slope of -3. IML 2011
Graph the linear equation which contains the point (4, 2) and has a slope of -3. IML 2011