Download

1 / 19
270 likes | 676 Views
Graphing Linear Equations. X and Y Coordinates. A coordinate or ordered-pair notation is always written as (x-coordinate, y-coordinate) or (x, y). They are always in parentheses with the value of x always first and the value of y always second. That will never change.

E N D
X and Y Coordinates • A coordinate or ordered-pair notation is always written as (x-coordinate, y-coordinate) or (x, y). • They are always in parentheses with the value of x always first and the value of y always second. That will never change. • Coordinates allow us to identify a specific place on a graphing system called the rectangular coordinate system. • A linear equation in two variables looks like:2x + y = 9 because it contains two variables, namely x and y.
Solutions of Equations in Two Variables • Determine if the following ordered pairs are a solution of the equation: x – 2y = 6 • (6, 0) (0, 3) (1, -5/2) Substitute the ordered pairs into the given equation: 6 – 2(0) = 6 0 – 2(3) = 6 1 – 2(-5/2) = 6 6 – 0 = 6 -6 = 6 1 + 5 = 6 6 = 6 -6 = 6 6 = 6 yes no yes
You try it…. • Determine which of the ordered pairs are solutions for the given equation:2x – 3y = 6 (0, 2) (3, 0), (6, 2) (0, -2) • Do the work first and then click the mouse button to see if you got them right!
Did you get them right? 2(0) – 3(2) = 6 2 – 6 = 6 -4 = 6 No 2(3) – 3(0) = 6 6 – 0 = 6 6 = 6 Yes 2(6) – 3(2) = 6 12 – 6 = 6 6 = 6 Yes 2(0) – 3(-2) = 6 0 + 6 = 6 6 = 6 Yes What this tells us is that the coordinates (3, 0), (6, 2), and (0, -2) can all be plotted on a graphing system and we can connect them together in a straight line. The point (0, 2) will not be on the line.
Completing Ordered Pairs • When finding a missing coordinate in a pair, you substitute the known coordinate into the equation and solve the equation to find the missing coordinate. For instance: x + y = 12 (4, ), ( , 5), (0, ), ( , 0) 4 + y = 12 y = 8 x + 5 = 12 x = 7 0 + y = 12 y = 12 x + 0 = 12 x = 12 The complete coordinates are then: (4, 8), (7, 5), (0, 12), and (12, 0)
You try it ….. • 5x – y = 15 ( ,0), (2, ), (4, ), ( , -5) 5(2) – y = 15 10 – y = 15 -y = 5 y = -5 5(4) – y = 15 20 – y = 15 -y = -5 y = 5 5x – 0 = 15 5x = 15 x = 3 5x – (-5) = 15 5x + 5 = 15 5x = 10 x = 2 The complete ordered pairs would be (3, 0), (2, -5), (4, 5), (2, -5). How did you do? Keep practicing if you are having problems.
The Rectangular Coordinate System Graphing
Rectangular Coordinate System The point (1, 5) is in line with the 1 of the x-axis and 5 on the y-axis. Quadrant 2 (-, +) Quadrant 1 (+, +) • (1,5) • x-axis Where the x-axis and y-axis meet is called the origin. Quadrant 3 (-, -) Quadrant 4 (+, -) y-axis
Completing a Table of Values • Complete the table for the equation 2x + y = 4 Substitute the known value from the table into the equation and solve for the other variable. 2(0) + y = 4 2x + 0 = 4 0 + y = 4 2x = 4 y = 4 x = 2 What is the value of x when y = 2? Click here to see if you were right.
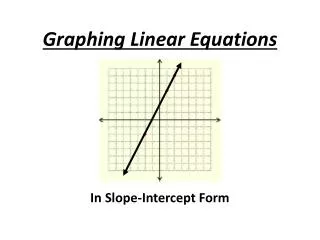
Graphing Linear Equations • A linear equation in two variables is an equation that can be written in the form ax + by = c (a, b, and c are coefficients) • Graph the linear equation x + y = 7Create a Table of Values and choose numbers for x or y. In this example we will substitute values for x. You can substitute any value you want and can choose either the x or y value to assign numbers to, it’s your choice. Hint: It’s easiest to choose the numbers 0, 1, or 2 when filling in the table of values. If fractions are involved, then use multiplies of the denominator.
Graphing Linear Equations (cont’d) • Complete a table of values for the equation x + y = 70 + y = 7 1 + y = 7 2 + y = 7y = 7 y = 6 y = 5 The completed table of values will give us the coordinates that we will use to plot the line on the rectangular coordinate system. (0, 7) (1, 6) (2, 5)
Graphing Linear Equations (cont’d) After you have found the points from the Table of Values and you plot them on the graph, your points must line up in a straight line. If they do not, then you made a mistake in your math and need to go back and check to see what went wrong. (0, 7) (1, 6) (2, 5) •(0, 7) •(1, 6) •(2, 5)
Vertical and Horizontal Lines • Vertical lines have an equation of x=c. • Horizontal lines have an equation of y=c. y = c x = c
Examples of Horizontal and Vertical Lines The red line means that whenever y is equal to any number, the x value will always be 5. Examples of coordinates would be: (5, 7), (5, 10), (5,-14), (5, -1) The value of x is always 5 which means it is a vertical line. • x = 5Since x is equal to a coefficient, in this case 5, then this is an equation of a vertical line. x = 5
Examples of Horizontal and Vertical Lines The blue line means that whenever x is equal to any number, the y value will always be 5. Examples of coordinates would be: (-1, 5), (-8, 5), (7, 5), (100, 5) The value of y is always 5 which means it is a horizontal line. • y = 5Since y is equal to a coefficient, then this is an equation of a horizontal line. y = 5
Slope of a Line • The formula for finding the slope of a line is: Caution: Be careful when substituting in the values of x and y into the formula. You may want to label your x and y variables in the coordinates so you do not mix them up. The “sub exponent 1” and “sub exponent 2” are very important.
Example for Finding the Slope of a Line Labeling your points is very important. • Find the slope of the line with coordinates of (5, 7) and (9, 11).
You try it ….. How did you do? Click the mouse button to see the correct answer. But please do try it first! • Find the slope of the line with the points(-3, 2) and (2, -8)