Download
1 / 27
270 likes | 369 Views
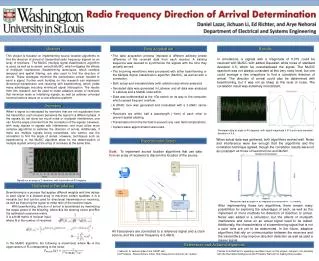
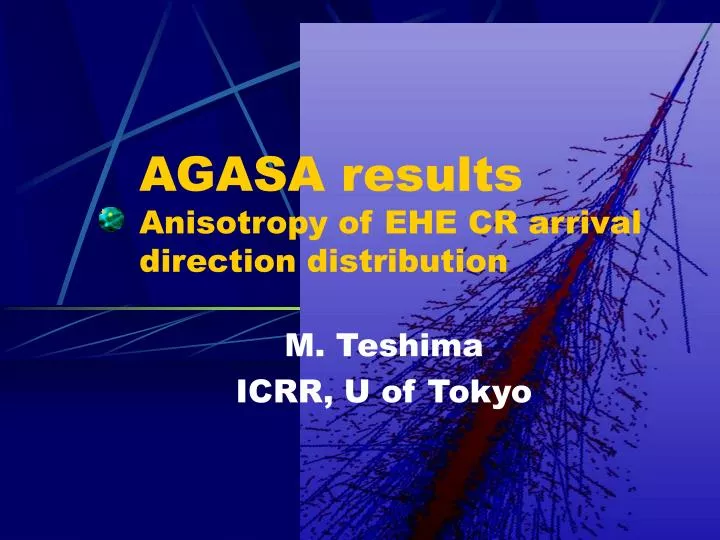
AGASA results Anisotropy of EHE CR arrival direction distribution. M. Teshima ICRR, U of Tokyo. Contents. Anisotropy at 10 18 eV Good evidence for Galactic Cosmic Rays Anisotropy above 10 19 eV Clusters in the arrival directions New Astrophysics. Cosmic Ray Propagation in our Galaxy.

E N D
AGASA resultsAnisotropy of EHE CR arrival direction distribution M. Teshima ICRR, U of Tokyo
Contents • Anisotropy at 1018eV • Good evidence for Galactic Cosmic Rays • Anisotropy above 1019eV • Clusters in the arrival directions • New Astrophysics
Cosmic Ray Propagation in our Galaxy • Deflection angle < 1 degree at 1020eV • Neutrons can travel galactic scale without decaying above 1018eV By M.Takeda
Candidates for C.R. accelerator Pulsar SNR A.G.N. GRB Radio Galaxy Lobe
Data A20: (~12km2) for 5years AGASA(~100km2) for 10years Event selection Core Location: inside the array Nhit >= 6 detectors χcore2<5.0, χdir2<5.0 Number of Events 284,000 events (>1017eV) Anisotropy at 1018eV
First Harmonic Analysis (Sep.1986-May.2001, 284,416 events)
Galactic Cosmic Rays up to 1018eV ●Use 284,000events over 15yrs operation by AGASA+AGASA Prototype ● >4σ near G.C. and -4σ near A.G.C. Amplitude ~4% Statistical Significance
Point Sources or Cosmic Ray flow
Dipole (G.C.-AGC) distribution Log(E) = 18.0-18.5 G.C Anti G.C.
DC excess with 6 degrees rad. Aperture Log(E) = 18.0-18.5
Conclusion • Harmonic Analysis, Global excess map (p.s. = 20o) • Pch < 10-4 (consistent with previous reports) • 4 σ near the GC and -4σ near AGC • The anisotropy of cosmic ray arrival direction at 1018eV observed by AGASA can be fitted with dipole distribution (GC --- AGC) • Point source analysis(p.s. = 6o), Self-correlation analysis No evidence for point sources. The data favors the diffuse sources.
Arrival Direction Distribution No Large Scale Anisotropy. Event Clusters: 1Triplet and 6 doublets P(chance) ~ 0.07%. Interacting Galaxy VV141 in the direction of triplet at 100Mpc. Arrival directions of 59events > 4 x10¹⁹eV observed by AGASA
Arrival Direction DistributionCompact sources!! ~5 sigma effect
The number of point sources Assume the same intensity sources, fit the multiplicity distribution 120 – 430 sources
V1-V2 plot in Galactic coordinateOuter Galaxy region|bII|<60, 90<lII<180 1. From 1019eV 2. Extended linearly ΔbII 20ox20o ΔlII Log(E)>19.00 19.15 19.70
The polarization angle 3.5σ at 40 degrees 1019eV 1.8 degree x 10 degree box
Cosmic Ray propagation in Galactic Magnetic Field ΔbII ΔlII Aperture By Stanev
Linearly extended halo in 2-D correlation map can be understood as deflected charged particles by G.M.F. Restrict G.M.F. structures (by GMT and MT) Magnetic field in disk Axial Symmetric Bi-symmetric Parity Even Odd Magnetic field in Halo Strength Bz~0.3μG Parity Odd Even On going Trace back cosmic rays up to Galactic Halo surface of 20kpc Identify sources!!
Self-correlation 2D-map (20ox20o) >19.0 >19.1 >19.2 >19.3 >19.4 >19.5 >19.6 >19.7
X1.51 X2.95 X2.04 X2.63 Differential Energy Spectrum of pair events(bin width = 0.2 decade) Structure? dF/dE ~ E-1.8+-0.3
He ? ? x1.86(+0.32-0.21) x4.46(+0.55-0.48) X2.4 Correlation as func. Of energy ratio between two events
Fe Naturally, Fe is expected at 2-3x10²⁰eV. Possible Scenario Rigidity dependent? Photo-disintegration cutoff? First bump --- 1ry and 2ndry p/n Second bump --- 1ry He Third bump --- 1ry BCNO p.d. p.d. BCNO He P
Monte Carlo Realization By T.Yamamoto et al Uniform Source Standard Chem. Comp. 10nG Magnetic Field Require Clustering Preliminary
Conclusion (>1019eV) • Clear evidence for point sources of EHECR • Elongated shaped excess of ~10°in 2-D correlation map • Consistent with the charged particle deflection by G.M.F. • Interesting structures in the energy spectrum of cluster events (Three bumps?) • Consistent with P, He, BCNO composition The beginning of the EHECR astronomy
To the future Clusters give you important information • Sources (Fe primary favors GRB remnants) • the chemical composition study for super GZK particle is important • G.M.F. structure can be uniquely solved • Constrain the inter-galactic Magnetic Field • 4πcoverage of sky is really important • Northern Hemisphere; Easy to understand G.M.F. structure, because it is simple toward outer galaxy. • Southern hemisphere; Observation is essentially important to understand whole G.M.F. structure.
Systematics and Resolution • In Mono analysis • Composition Proton/Fe??? • Interaction QGSJET/SIBYLL • Scale height of Mie layer • In Atmosphere (In Mie Scattering) • Horizontal attenuation • Scale height • 1-D model reality (locality) • E (Rp) dependence • 10,000km2sr 100% efficiency upto Rp ~ 40km