Download
1 / 13

E N D
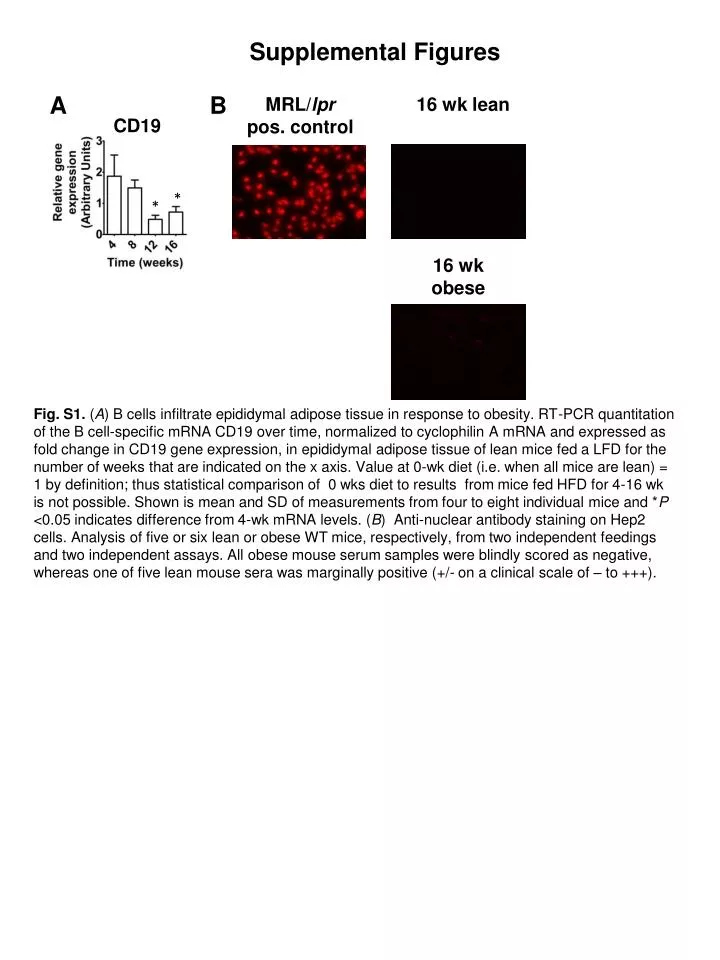
Supplemental Figures A B CD19 * * Fig. S1.(A)B cells infiltrate epididymal adipose tissue in response to obesity. RT-PCR quantitation of the B cell-specific mRNA CD19 over time, normalized to cyclophilin A mRNA and expressed as fold change in CD19 gene expression, in epididymal adipose tissue of lean mice fed a LFD for the number of weeks that are indicated on thexaxis. Value at 0-wk diet (i.e. when all mice are lean) = 1 by definition; thus statistical comparison of 0 wks dietto results from mice fed HFD for 4-16 wk is not possible. Shown is mean and SD of measurements fromfour to eightindividual mice and *P <0.05 indicates difference from 4-wk mRNA levels. (B) Anti-nuclear antibody staining on Hep2 cells.Analysis of five or six lean or obese WT mice, respectively, from two independent feedings and two independent assays. All obese mouse serum samples were blindly scored as negative, whereas oneof five lean mouse sera was marginally positive (+/- on a clinical scale of – to +++). MRL/lpr pos. control 16 wk lean 16 wk obese
B 96.8% B cell purity 103 C A Purified B cell MIP-2 Splenocyte IL-5 SSC-H 102 Lean Lean Obese Obese 101 pg/mL pg/mL * 100 101 102 103 104 CD19 Fig. S2.(A)IL-5 in supernatants from total splenocytes from lean or obese mice, with cells stimulated as indicated.(B)Purity of splenic B-cell preparations reanalyzed by flow cytometry based on CD19 expression (xaxis). One representative analysis shows >96% pure B cells.(C)Macrophage inflammatory protein 2 (MIP-2) in supernatants from purified B cells stimulated as indicated. ForA and C,n= 6-8 per group. Bars show mean and SEM. Significant differences are indicated by: *P< 0.05 in comparison of obese and lean animal results for the same stimulus; #P < 0.05, ##P< 0.01, stimulated compared with respective unstimulated (media) control with the same obesity status. ForB, SSC-H designates side scatter height.
A Live Cells Dead Cells Singlets Doublets B cell depleted population B cells MZ CD21 B220 FO CD23 C D 97.1% 96.1% FO B220 B220 B MZ 96.7% E 95.2% CD21 MZ CD21 96.2% 96.1% FO CD23 B220 B220 CD23 Fig. S3.Gating strategy for flow cytometry.(A)Gating strategy for the sorting of B cell-depleted population (single live B220- cells), B-cell population (single live B220+ cells), marginal zone B cells (MZ; single live B220+ CD23- CD21high) and follicular B cells (FO; single live B220+ CD23high CD21med/low).(B-E)Purity of FACS sorted subpopulations reanalyzed by flow cytometry; representative samples shown for each gate.(B) B cell-depleted population (single live B220- cells).(C)B-cell population (single live B220+ cells).(D) Follicular B cells (FO; single live B220+ CD23high CD21med/low). (E)marginal zone B cells (MZ; single live B220+ CD23- CD21high).
IL-10 IL-6 # # # # # * * * * * * * # # # # # # # # Fig. S4.Follicular B cells secrete the majority of proinflammatorycytokines in response to obesity. Cytokine production by total B220+ B cells, follicular B cells (FO), and marginal zone B cells (MZ) from lean or obese mice with cells stimulated as indicated.LPS, purified Escherichia coli lipopolysaccharide (TLR4 ligand); Pam3, Pam3CSK4 (TLR2 ligand).n= 6 per group. Bars show mean and SEM. Significantly different groups are indicated by *P< 0.05 in comparison of obese and lean group for the same treatment; #P< 0.05, stimulated compared to respective unstimulated (media) control within the same diet group, calculated by two-way ANOVA. Very low IL-10 production by MZ B cells may be, in part, due to age of mice relative to previous demonstrations that MZ B cells produce significant amounts of IL-10 (1). 1. Barr, TA et al. B cell depletion therapy ameliorates autoimmune disease through ablation of IL-6 producing B cells. J Exp Med 209(5): 1001-1010.
WT μMT A C D B % Adipocytes per Size Class αF4/80 WT * * * * * * * μMT * $ $ $ $ F * * $ E G $ $ $ FFA TAG % Adiposity (g fat/g body wt) Lean Mass (g) Steatosis Score mEg/L mg/dL Total I H J RER: Avg. WT and mMT vs. Interval Adiponectin * # HMW # # Fed Fasting WT WT mMT mMT WT WT mMT mMT lean lean obese obese
Fig. S5.B cells promote adipocyte hypertrophy. (A)H&E staining (Left) and the distribution of adipocyte area in s.c. (subcutaneous inguinal) AT. (Scale bar,200 μm).A-G are samples from obese mice on a HFD for 16 wk.(B)Adipocyte cell number in epididymal (epi) ands.c. (sub) white adipose tissue. (C)F4/80 staining of WT and μMT adipose tissue. Arrows pointing to brown dye indicate positively stained cells.(Scale bar,200 μm).(D)Gene expression analysis of macrophage markers.(E) AT weights from depots as indicated.(F)NMR for whole animal adiposity or total lean mass in WT and µMT mice.(G)Fastingserum free fatty acids, fasting serum triglycerides, and hepatosteatosis scoring as indicated. (H)Respiratory exchange ratio (RER) analysis after 12 wk on HFD under fed or fasted conditions as indicated. Shown is mean of five mMT or six WT mice on 60% HFD, as absolute value or following curve fit analysis. Data from 45% HFD fed animals, as well as VO2 and CO2,are also similar between genotypes.(I)Glucose tolerance tests of lean WT (black triangles) and μMT (gray triangles) and obese WT (black circles) and μMT (gray circles) mice after 8 wk on HFD. Analysis at 14-wk HFD gave similar results.(J)Total (Upper) or high molecular weight (HMW; Lower) fasting serum adiponectin in mice as indicated.n= 6-8 for each panel unless otherwise indicated, and when appropriate, mean and SEM are shown. ForB, D,and E, * WT and MT data are significantly different (P< 0.05) by Student ttest. ForI, *P< 0.05 indicates a significant difference for mice within the same diet group;$P< 0.05 indicates a significant difference for mice within the same genotype, determined by two-way repeated measures ANOVA. ForJ, *P< 0.05 indicates WT and MT data are significantly different within diet group; #P< 0.05indicates values from obese and lean mice are significantly different (P < 0.05) within genotype as determined by Student ttest.
Regulatory T cell (Treg) gating strategy Fig. S6.Treg gating strategy. Tregs are identified as CD4+CD3+Foxp3+CD25+cells. SSC, side scatter; FSC, forward scatter.
αCD8 αCD4 Fig. S7.Immunohistochemistry of CD8 and CD4 T cells in epididymal adipose tissue paraffin sections. Arrows pointing to brown dye indicate positively stained cells. (Scale Bar,200 μm). WT μMT WT μMT
FMO A LFD HFD CD278 B 16.5% 1% 17.3% CD278 FoxP3 FoxP3 FoxP3 LFD FMO HFD Fig. S8.Flow cytometry analysis of CD278+ (inducible T cell COStimulator, ICOS) Tregs from mouse spleen. Tregs were identified as CD3+CD4+CD25+Foxp3+ with gating strategy shown in Fig. S6. (A)Mean Fluorescence Intensity (MFI); representative samples from lean and obese mice are shown along with the bar graph.n= 3. (B)Percent CD278 positive Tregs,n = 3. FMO,Fluorescence minus one, a negative control for CD278 staining.
Re-analysis of purified immune cells CD14 CD19 CD3 CD19 FSC FSC monocytes B cells T cells Fig. S9.Re-analysis of human blood immune cells for purity by flow cytometry based on CD3 (Left, FCS, forward scatter); CD19 (Center) and CD14+CD19-(Right). T cells were the major contaminant (<4%) in all B-cell and monocyte preparations.
IL-6 IFN-γ IL-10 # # # Lean # Obese * * * # # # Fig. S10.Cytokine production by purified splenocytes plus or minus B220 B cells from lean and obese mice, plus or minus T cell-specific stimuli anti-CD3 + anti-CD28.n = 6. Bars show mean and SEM. Significantly different groups are indicated by: *P< 0.05 in comparison of obese and lean group for the same treatment; #P< 0.05 indicates stimulated compared to respective unstimulated (media) control within the same diet group; $P < 0.05 indicates splenocyte – B220 group in comparisonwithtotal splenocytes within the same diet group, calculated by two-way ANOVA. $ $ $ $ $ # # # # #
SI Materials and Methods: Flow Cytometry.For T-cell phenotypic staining, blood leukocytes, splenocytes, ors.c.(inguinal) adipose tissue (AT) preparations were incubated with anti-mouse CD16/CD32 (eBioscience) , LIVE/DEAD Fixable Aqua (Invitrogen), and the following directly conjugated monoclonal antibodies FITC NK1.1, PE CD25, PerCP CD69, APC CD8, Efluor 780 CD4 and Pacific Blue CD3 for 30 minutes at 4oC. For regulatory T cell (Treg) staining, cells were incubated with FITC CD3, PE CD25, PerCP CD8 (BioLegend), Efluor 780 CD4 plus anti-mouse CD16/CD32 for 30 min on ice and then treated with Foxp3 Fixation/Permeabilization solution (eBioscience) for 4 h. Cells were washed twice with Foxp3 permeabilizationbuffer and then stained with anti-mouse Foxp3 (APC conjugate) in Foxp3 permeabilization buffer (30 min at room temperature) before analysis as above. All directly conjugated antibodies were from eBioscience unless mentioned otherwise. CD278 (inducible T cell COStimulator, ICOS) staining was performed with CD278 Pacific Blue (BioLegend) combined with other surface stains. FACSSorting.Freshly isolated splenocytes were washed with FACS buffer (PBS with 0.5% BSA and 2 mM EDTA), and were incubated with anti-mouse CD16/CD32 (eBioscience) , LIVE/DEAD Fixable Aqua (Invitrogen), and the following directly conjugated monoclonal antibodies B220 APC (Biolegend), CD21 Brilliant Violet 421 (Biolegend), CD23 PE-Cy7 (Biolegend) for 30 min at 4oC. Cells were washed twice with FACS buffer, and sorted on a FACS Aria flow cytometer (BD Biosciences). All cells were stained at a concentration of 1 x 10⁷ cells per 100 μl of staining mixtures. For all sorts, doublets were excluded from the sorted population via gating discrimination using forward scatter area (FSC-A) and forward scatter height (FSC-H). Purity was verified by analyzing sorted population on FACS Aria and was greater than 96% in all populations tested. Gene Expression. Custom-designed SABioscience (Qiagen) 384-well RT-PCR array plates using proprietary primers were purchased for gene expression analysis. Target genes were normalized to the arithmetic mean of two housekeeping genes Hprtand Rplp0, unless otherwise noted, by the 2-ΔΔCt and all data are reported as relative to WT low-fat diet (LFD) control group. Immunohistochemistry andHistomorphometry. Paraffin-fixed tissue sections were stained with the following antibodies: α-mouse F4/80 (1:10,000, Cedarlane), α-human CD4 (1:1000, R&D Systems), α-humanCD8 (1:500, R&D Systems), or rat IgG control antibody (1:10,000) and counterstained with H&E. Adipocyte areas were quantified fromH&E stained 5-M sections with Image J (NIH) or Image Viewer/iScanCoreo Au (Ventana Medical Systems). Adipocyte cell number was calculated by the method of Bourgeouis et al (1). Liver steatosis was scored on a 1-4 clinical scale by multiple blinded observers. Whole Animal and Intact Tissue Studies.Male mice on a C57BL/6J background were ordered from Jackson Laboratory and maintained on site in sterile cages or were bred in-house. Results from µMT (B cell-null, verified by absence of CD19+ B cells in flow cytometry) mice bred in-house or at Jackson Laboratory were indistinguishable. Five-week-old mice were fed ad libitum with high-fat diet (HFD) or LFD (60% or 10% calories from fat, respectively; Research Diets) for 16 wk unless otherwise indicated. HFD- and LFD-fed mice are designated obese and lean, respectively. For all measurements, results from multiple mice and at least two independent feedings were averaged. Fasts were for 6 hunless otherwise indicated. Glucose or insulin tolerance tests were performed byi.p.injection of 1 g/kg sterile D-glucose or 0.75 U/kg of Humilin, respectively, and monitoring of tail vein blood via glucometer. Fat and lean tissue were measured as a percentage of body fat with NMR. Respiratory exchange ratio, which indicates the metabolic fuel source as carbohydrate vs. fat, was measured in Oxymax metabolic cages for 24 hunder fed and fasted conditions.
Tissues for sectioning were immediately fixed in Z-Fix postharvest, then stored in PBS. Serum for cytokine analyses was collected in BD Microtainer tubes (BD Biosciences). Tissues for immune cell analysis were immediately processed per the main text. Antinuclear antibodies were measured as previously described (2). Serum from an MRL.lpr lupus mouse or a lean C57BL/6 mouse was used as a positive or negative control, respectively. Staining was scored in a blinded manner. Spontaneous leptin secretion from epididymal AT was quantified from supernatants collected following incubation of 30-100g of the testis-distal tip of the epididymal AT pad in Hepes-buffered DMEM for 2 h, and is expressed asnanogram per gram whole epididymal AT weight per ml media. Human Subjects/Samples.Both type 2 diabetic (T2D) and non-T2D cohorts excluded individuals with common infections <2wk before donation or those with non-T2D-related inflammatory or auto-immune disease. T2D patients were defined as (i) under the care of a Center for Diabetes provider; (ii) on one or more diabetes medications; and (iii) having a diagnosis of diabetes on the clinical problem list. All donors were non-smokers. Study design was cross-sectional. The data cannot account for the effect of drugs taken by both cohorts, given the limited number of samples analyzed (n< 25) coupled with the extensive list of drugs taken by obese/T2D individuals. Purified human immune cells were co-cultured at ratios that approximated ratios in human blood (2 monocytes: 1 B cell: 12 T cells) at a total cellular concentration of 106/ml. Statistics.All data are shown as mean ± SEM unless otherwise indicated. One-way, two-way, three-way and repeated measures ANOVA were performed in conjunction with Tukey’s honestly significant difference test using the car package in R (3,4). Student’s T test and Pearson’s chi-squared test were also performed(4)(GraphpadPrism v5.0). Significance was set atP< 0.05 unless otherwise noted. Bourgeois F, Alexio A,Lemonnier D (1983) Dietary-induced obesity: Effect of dietary fats on adipose tissue cellularity on mice. Br J Nutr49(1):17-26. Richez C, et al. (2010) IFN Regulatory Factor 5 is Required for Disease Development in the FcγRIIB-/-Yaa and FcγRIIB-/- Mouse Models of Systemic Lupus Erythematosus. J Immunol184(2):796-806. Fox, J & Weisberg S (2011) An {R} Companion to Applied Regression, (Sage, Thousand Oaks, CA), 2nd Ed. R Development Core Team (2008) R: a language and environment for statistical computing (R Foundation for Statistical Computing, Vienna, Austria).