Download
1 / 40
670 likes | 3.23k Views
Overview of Real -Time PCR. Real-Time PCR combines DNA amplification with real time amplified product detection in a single tube. More specific then gel or hybridization assays. Less time consuming Quantitative results as opposed to semi-quantitative or qualitative results.

E N D
Overview of Real -Time PCR • Real-Time PCR combines DNA amplification with real time amplified product detection in a single tube. • More specific then gel or hybridization assays. • Less time consuming • Quantitative results as opposed to semi-quantitative or qualitative results. • Human (higher primate) or Y chromosome specific • Monitors for PCR inhibition
Introduction • Methods based on changes in fluorescence proportional to the increase in either specific or non-specific PCR product. The fluorescence is monitored during each PCR cycle to provide an amplification plot allowing the user to follow the reaction.
High –Throughput Systems • ABI Prism SDS 7000 • ABI Prism SDS 7700 • ABI 7300 and 7500 Real-Time PCR Systems • iCycler iQ • Mx 3000p Multiplex quantitative PCR system
ABI Prism SDS 7000 • 96 well format • Illuminated by a tungsten-halogen lamp • 4 optical filters • Optimized for FAM, SYBR green I, VIC, Yakima Yellow, TAMARA and ROX dyes • Multiplexing capabilities • Time: 2 hours • Display includes disassociation curve, and results during the run
ABI Prism SDS 7700/7900 • 96 well format.(7900 has 384 well format and robotic capability). • Excitation is done by a laser. • Fluorophores with an emission between 500 and 660 nm can be used. Includes FAM, TET, JOE, Yakima Yellow, VIC, ROX, TAMARA, SYBR green I. • 2 hour run time.
ABI 7300 and 7500 Real-Time PCR Systems • 96 well plate format • Excitation by Tungsten-Halogen lamp • 25-100 µl reaction mix. • 7300- FAM, SYBR green I VIC, Yakima Yellow, or JOE, TAMARA, ROX • 7500- 5 color detection (NED, Cy3, Texas Red, Cy5) better sensitivity with longer wavelengths • 2 hour run time
iCycler iQ • BioRad • 96 well format • PCR machine with an optical unit • Halogen light source • CCD camera measures emission from each well simultaneously and detects 4 colors at once (FAM, SYBR green I, VIC, Yakima Yellow, HEX, TET, Cy3, Cy5, Texas Red, TAMARA, ROX • 2 hour run time
Mx3000p Multiplex quantitative PCR system • Stratagene • Detects 4 fluorophores w/in the same reaction using four different channels (customized filters). Multiplexing ( 4 different targets at the same time). • 96 well format • Halogen lamp • 350-750nm • Detection- Scanning photomultiplier tube (PMT) • Dyes- FAM, SYBR green I, TET, HEX, JOE, VIC, Yakima Yellow, TAMARA, Cy3, Cy5, Texas Red, ROX, Alexa Fluor 350 • Run Time 350
Flexible Instruments • LightCycler 2.0 Instrument • Smartcycler • RotorGene 3000 Four Channel Multiplexing System • Used for multiplexing and performing multiple experiments each with a different set of parameters at the same time.
Quantitative and Qualitative PCR Technologies • Two types of Real-Time PCR detection chemistries • 1. Specific Sequence Detection- Distinguishes between a specific sequence of interest and non-specific products. Can be used to detect different alleles. • 2. Non-Specific Detection- Detects any dsDNA produced during the reaction
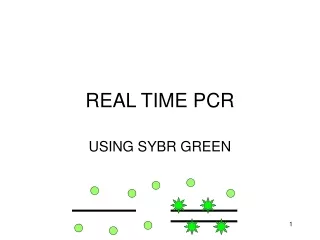
Non-Specific Detection Systems • Uses a dsDNA intercalating dye that that fluoresces once bound to DNA. The most common is SYBR green 1. Excites at 497 nm and emits at 520 nm. • Do a melting curve start at 40°C-95°C. The fluorescence will decrease when the dsDNA disassociates. This depends on length and bp composition. If the PCR reaction is optimized will get a single peak corresponding to the proper primer pair. Can be useful in quantifying DNA. • Useful in optimizing a PCR reaction before developing more expensive specific tests.
Specific Detection Systems • TaqMan Probes • LNA Double –Dye Oligonucleotide probes • Molecular Beacon Probes • Scorpions primers
TaqMan Probes • Double- Dye Oligonucleotides or dual labeled probes. • Method of choice for forensic DNA quantitation • Consists of a ssDNA probe that is complemenatry to one of the amplicon strands • A fluorophore (FAM) is attached to one end of the probe and a quencher (TAMARA) and a quencher to the other end. The fluorophore is excited my the instrument and passes its energy via FRET to the quencher.
FRET and NFQ • Fluorescent Resonance Energy Transfer • NFQ- Non- Fluorescent Quencher
FRET Technology • High energy fluorophore (reporter dye; 6FAM) is close to the NFQ and the energy will transfer from high to low. As PCR products are formed the specific TaqMAn probe will anneal to its complementary sequence in the amplicon. Taq Polymerase (due to its 5’-3’ nuclease activity) will cleave the probe separating the fluorophore (reporter) dye from the quencher. The fluorescence is no longer quenched and is proprotional to the number of amplicons produced.
Uses for TaqMan Probes • DNA Quantitation • Mutation Detection-Probe designed to hybridize over mutation • Allelic Discrimination • Gene Expression • Can be multiplexed • Dark Quenchers- absorb emitted energy, but release it as heat as opposed to fluorescence
LNA Double Dye Oligonucleotide Probes • LNA- Locked Nucleic Acids • Integrating LNA bases into the DNA duplex of the double dye oligonucleotide probes will change the conformation from the B to the A form and increase its stability, thus increasing its TM value resulting in shorter, more specific probes. • Useful in applications requiring high affinity probes such as SNP detection, gene expression profiling and in situ hybridization.
LNA Bases • LNA is a bicyclic RNA analogue in which the ribose moiety is structurally constrained by a methylene bridge between the 2’- oxygen and 4’- carbon atoms. When these LNA bases anneal with the DNA bases they cause a conformational change to occur in the helix.
Molecular Beacon Probes • Consist of a hairpin loop where the loop is a single- stranded probe that is complementary to the amplicon. The stem is usually 6 bases long and consists mostly of C and G’s. It holds the probe in the hairpin structure. A fluorphore is attached to one of the stem and a quencher the other. When the amplicon is produced during PCR, the probe will bind to its specific target sequence provided the probe-target duplex is thermodynamically more stable then the hairpin loop at the fluorescent acquisition temperature. After the probe binds to its target the hairpin is opened and the fluorophore and quencher are separated.
Continued • The increase in fluorescence is reversible because until the temperature is high enough the hairpin loop will reform. This can produce a melting curve that is useful for observing the dynamics of the reaction and determining the best temperature for fluorescence acquisition.
Scorpion Primers • PCR Primers with a stem-loop tail containing a fluorophore and a quencher. The tail is separated from the primer by a “PCR blocker”,a chemical modification that prevents Taq from copying the stem-loop tail of the Scorpion primer. This prevents non-specific opening of the loop. The PCR blocker links the loop to the 5’ end of the primer. The primer extends during the PCR amplification and the specific probe sequence will bind to its complement sequence. The hairpin loop opens up during hybridization and the fluorescence is no longer quenched. Because enzymatic cleavage is not required the time it takes to detect fluorescence is decreased. Main advantage to TaqMan probes is low background and fast reaction mechanism. Binding is more specific then TaqMan probes and can produce a melt curve analysis like Molecular Beacon probes. They can be used in DNA quantitation, allelic discrimination and mutation detection. Capable of multiplexing.
Fluorophore and Quencher • The choice of which fluorophor and quencher combination to use will give different results in terms of sensitivity. • Fluorophore- a molecule that emits light of a certain wavelength after having absorbed light of a specific, but different wavelength first. The emission wavelength is always higher than the absorption wavelength. The fluorophore absorbs light energy and is promoted to an excited state, when it falls back to its ground state the excess energy is released. • Quencher- a molecule that accepts energy from a fluorophore in the form of light and disapates this energy either in the form of light or heat.
Fluorophore and Quencher Structures • Flourophore • Quencher
Proximal and FRET Quenching • Proximal- Fluorophore is in close proximity of the quencher energy is transferred from fluorophore to quencher and dissipates as heat w/o fluorescence. Also called collisional quenching. Dark Quenching. • FRET Quenching- The fluorophore transfers its energy to the quencher (which can be another fluorophore); the energy is released as fluorescence of a higher wavelength. The efficiency is related to the distance (more precisely the Forster distance 1/r6, where r = the fluorophore distance) between the fluorophore and quencher. TAMARA
Proximal and FRET Quenching Diagram • Proximal • FRET
Optimal Fluorphore Quencher Combination • The absorption spectrum of the quencher needs to have good overlap with the emission spectrum of the fluorphore to achieve optimal quenching. Quenchers have a quenching capacity throughput their absorption spectrum, but work best close to their absorption maximum.
Efficient Quenching of Fluorphores • If the fluorescence is to high due to incomplete quenching the relative fluorescence signal (signal to noise ratio) will decrease. The fluorophore-quencher combination which gives the highest signal to noise ratio should be selected.
ROX Passive Reference • Used by ABI • Correct for pipetting inaccuracies • Does not participate in PCR • Provides an internal fluorescent reporter to which the reporter fluorescent can be normalized
Rn and Bn • Rn (normalized reporter signal)= reporter signal/ROX passive reference signal • This corrects for pipetting error only, not background. • ΔRn is used to correct for background. • ΔRn= Rn – Bn • Bn (normalized baseline)= baseline signal/ROX passive reference • ΔRn= (reporter signal/ROX passive reference signal)- (baseline signal/ROX passive reference signal • Thus the ROX passive reference signal influences both the Rn and Bn
Ct Value • Ct value- The cycle in which a significant increase in reporter signal above threshold can be detected, i.e. the cycle in which the growth curve crosses the threshold. • The automatic threshold is calculated by the software and is defined as: (average baseline plus) (standard deviation of the baseline) • The ROX reference influences the baseline and noise level. When the level of ROX increases, the noise will decrease as will the ΔRn. It is therefore important to determine the right level of ROX that does not compromise ΔRn. • The Ct value is directly dependent on the threshold level and indirectly dependent on baseline level and ROX reference level. Minor variations in ROX level can change Rn, Bn, ΔRn, threshold and Ct. • Use a Master Mix that already contains ROX
Quantitative PCR • Quantitative PCR software uses the exponential phase of PCR for quantitation. PCR is initially an exponential process but reaches a plateau phase as one or more of the reaction reagents become limited. Reactions can plateau at different levels even if they have the same starting concentration of target. During the exponential phase the amount of target is assumed to be doubling every cycle w/o any bias from limiting reagents. Analyses use the Ct value, the point cycle number, at which the signal is detected above the background and the amplification is in the exponential phase. The samples with the most abundant amount of DNA template reach the Ct value earlier than the samples with less starting DNA. The results are normalized by comparing them against a standard curve developed by running a series of known DNA standards each of which has a different DNA concentration.
Caution Notes: • 1. DNA concentration results are dependent on Molar Ratios and Molar Concentrations. When comparing results, make sure that the reaction volumes are the same. • 2. Be wary of comparing results from different instruments or different platforms