Download
1 / 23
240 likes | 401 Views
Compilation of benthic metrics and their suitabiliy for the assessment of the ecological status of coastal and transitional water in Germany - macrozoobenthos-.

E N D
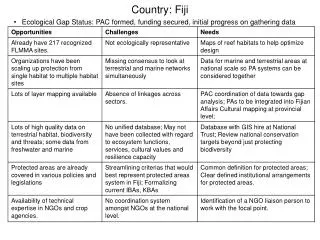
Compilation of benthic metrics and their suitabiliy for the assessment of the ecological status of coastal and transitional water in Germany - macrozoobenthos- This study is part of the project ‚ Assessment of the eutrophication status of transitional and coastal waters of the North Sea (OSPAR and WFD)’ from Uwe Brockmann and is supported by the Environmental Agency of Germany (UBA). Assessment methods were compiled from the literature and possibly suitable metrics were choosen to test, whether they are useful for an assessment of the ecological status of the Wadden Sea. • Is the macrozoobenthos a useful indicator for the assessment of the ecological status of an ecosystem? • What are the metrics, how do they work and what are they able to afford? • Which ones are the assessement methods from other EU-Memberstates and other countries? • Presentation of results and classifications from some Wadden Sea stations received with different metrics. • Summary and lack of knowledge. • US assessment method for the Chesapeake Bay
Is the macrozoobenthos a useful parameter for the assessement of the ecological status? Yes, because • it has generally limited mobility and can‘t avoid adverse conditions. Therefore it reflects local environmental conditions. • Partly the organisms are long-lived, so they integrated for a longer period. • Species determination is comparable simple. • There is a lot of knowledge in autecology. • There are much more data, than for other animal groups. But there is a great difficulty because the structure of the benthos reflects also anthropogenic stress and natural variation e.g. sediment characterics. Mostly it is impossible to separate the causes for the variation to anthopogenic or natural (e.g. serve winters) impacts.
How do the zoobenthos community react on different disturbances? • Species number • Abundance • Biomass
Netherland Wadden Sea With increasing chorophyll concentration in the pelagic zone the zoobenthos biomass is also increasing. f = strong fisheries c = cold winters Beukema et al. 2002
But not in all regions of the Wadden Sea an increase of the zoobenthos biomass and abundance or species composition is detectable .. From Essink et al. 1998.
Station locations for the tests of the indices (AMBI and diversity indices) Riesen & Reise 1982 Reise & Schubert 1987 LANU DAGEBÜLL LANU NS1 LANU NS2 LANU NS3 LANU NS4 LANU NORDSTRAND LANU BÜSUM
Ecological assessment from 3 Stations in the Wadden Sea in comparison of 1924/25 : 1980/85 Ellenbogen + Huntje Norderaue
Sublittoral North Sea stations LANU NS 2 NS 3 NS 1 Eulittoral Wadden Sea stations LANU Dagebüll Nordstrand Büsum
Assessment of the LANU Stations NS 2 NS 3 NS 1 Dagebüll Nordstrand Büsum
Shannon-Weaver-Index LANU Stationen NS1, Dagebüll, Büsum and ‚historical‘ comparison 20s : 80s Jahre
Classifications BÜSUM DAGEBÜLL II III IV V
Summary and lack of knowledge • Changes in the macrobenthos due to anthropogenic impacts are measurable, but not in all regions in the same way. • !!On the basis of index values it is not possible to draw conclusions on the sort of impact. • Only the AMBI index gives for all stations and dates plausible results, but not the Shannon-Weaver Index. • Reference conditions have to be defined, because a high level of the parameters biomass, species or individual numbers can result from very good ecological situation as well as at the beginning of an impact. • Species lists have to be checked for the Wadden Sea • Classification schemes and classification of the species to the 5 groups have to be adapted to the Wadden Sea conditions. • The AMBI should be tested at more Wadden Sea stations and should be correlated with other parameters e.g. TOC or grain sizes.
prospects for the future Proposal of Borja
US EMAP (Environmental Monitoring and Assessment Programme) Benthic conditions Loss of wetlands Transparency of the water Assessment of the habitat by calculation the arithmetric mean of all 7 indicators (1 poor to 5 good) Dissolved oxygen Sediment conditions Eutrophication conditions Accumulation of Contaminants in Fish tissues
Chesapeake Bay, as an example for an assessment method Location of Chesapeake Bay Salinity conditions
Estuarine Benthic Index of Biotic Integrity (B-IBI) (after Weisberg et al. 1997) • 7 Habitats: • freshwater; • oligohaline; • low mesohaline; • high mesohaline –sand; • high mesohaline – mud; • polyhaline-sand; • polyhaline- mud 1st Step: Division in habitats: Clustering 115 stations 2nd Step: Reference stations, choosen from the data set Criteria: TOC < 2%, no O2 depletion, sediment concentrations of contaminants below thresholds For each of the 7 habitats ca. 10 stations were choosen as reference sites
Diversity: Shannon-Weaver Productivity: abundance, biomass Species composition: % pollution indicative-taxa and pollution-sensitive biomass and abundance Trophic composition: % abundance carnivores or omnivores, deep deposit feeders, suspension feeders, interface feeders Depth distribution below sediment-water interface: % taxa, abundance and biomass deeper than 5 or 10 cm. 3rd Step: Calculation of 17 metrics for each habitat and the corresponding reference sites:
4th Step: Statistical tests: U-Test and Kolmogorov Smirnov test Calculted metrics were compared with the appropiate reference sites 5th Step: Selection of metrics for the final assessment Only those metrics were choosen for the assessment, which gave significant differences between habitat and the appropiate reference sites, so that for the 7 habitats different metrics were selected: Biomass, abundance and Shannon-Weaver is calculated for each habitat, but % abundance of pollution-indicative taxa (5), abundance of feeding types (4) and biomass of pollution sensitve taxa (3) only for some of the habitats
6th Step: Comparison of the metrics from the habitat with thresholds of reference sites. 3 classes: 1, 3 and 5 1 if habitats deviated greatly from reference stations. Assemblages with an average score less than 3 are considered stressed. • with new data for the reference sites and habitates • with data from the whole year. 7th Step: Validation of the method