Download
1 / 21
210 likes | 310 Views
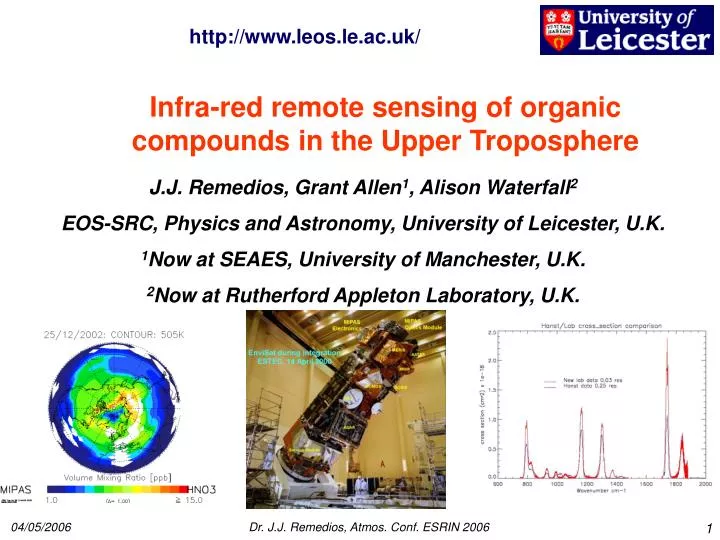
http://www.leos.le.ac.uk/. Infra-red remote sensing of organic compounds in the Upper Troposphere. J.J. Remedios, Grant Allen 1 , Alison Waterfall 2 EOS-SRC, Physics and Astronomy, University of Leicester, U.K. 1 Now at SEAES, University of Manchester, U.K.

E N D
http://www.leos.le.ac.uk/ Infra-red remote sensing of organic compounds in the Upper Troposphere J.J. Remedios, Grant Allen1, Alison Waterfall2 EOS-SRC, Physics and Astronomy, University of Leicester, U.K. 1Now at SEAES, University of Manchester, U.K. 2Now at Rutherford Appleton Laboratory, U.K. Dr. J.J. Remedios, Atmos. Conf. ESRIN 2006
Structure of the talk • MIPAS spectra of the UT • Organic compounds in the UT • Importance • Spectroscopic detection of ethane • Laboratory spectroscopy • Detection in atmospheric spectra • Summary Dr. J.J. Remedios, Atmos. Conf. ESRIN 2006
MIPAS instrument on ENVISAT • Limb Sounding, Profiles: 6- 68 km; nominal 3 km vert. resn/spacing (6-48 km) • F.T. i/r emission spectrom: 685-2410 cm-1 in 4 bands. 0.025 cm-1 resn. (unapod.) • Coverage: pole to pole. Profiles every 75 s or approx. 500 km. • Operational products: • Calibrated infra-red spectra (level 1b) • p/T, O3, H2O, HNO3, CH4, N2O, NO2 (level 2) • Huge potential: • CLOUDS: PSCs • > 20 other trace gases. EUROPE’S LARGEST FREE FLYER. LAUNCHED ON MARCH 1st 2002 Dr. J.J. Remedios, Atmos. Conf. ESRIN 2006
MIPAS Infra-red spectra – unprecedented series of thermal emission spectra Influence of clouds observed as: • distinct spectral offset dependent on optical depth (extinction) • pressure-broadened gas absorption lines from tropospheric radiation scattered into the limb path (cloud location, temp., mean particle size) • characteristic spectral features for NAT PSCs • Influence on trace gas retrievals Comparison of MIPAS spectra for clouds of different optical depth in the field of view, tangent height 15.7 km, 5th May 2003. J. Greenhough, Leicester Dr. J.J. Remedios, Atmos. Conf. ESRIN 2006
CH4, HC NO CO NO, O3 ORGANIC COMPOUNDS IN THE UT Volatile organic compounds are of major importance in tropospheric chemistry. Remote sensing methods could help to determine their distribution. – we could obtain global coverage. Currently limited to in situ campaigns (e.g. aircraft). Current remote sensing: formaldehyde in u/v-visible, else infra-red Concentrate on PAN (+ 2 compounds) here: • Active Nitrogen reservoir: Peroxyacetyl Nitrate (PAN) • NMHCs. Examples: Ethane, ethyne, propane Dynamic tracers Sources of reactive hydrocarbons • Oxygenated hydrocarbons Examples: acetone, formic acid, methanol Ozone chemistry – mediation between O3/OH with NOx RO2 HO2 OH Dr. J.J. Remedios, Atmos. Conf. ESRIN 2006
Expected spectral signatures Detection of expected spectral signatures • Band identification • Line identification e.g. rotational line spacing, PQR branches • Multiple band identification • Direct matching of spectra • Matching with calculated spectral signature • Matching with Jacobian calculations (sensitivity of signal to 1% change of mixing ratio at tangent height) • Matching of Jacobian with difference between spectra recorded for 2 tangent altitudes.* • Correlation and Students t-test analysis Geophysical behaviour • Invaluable aid • Requires “well-known” variation of species, e.g. as a function of latitude, altitude, temperature etc. • Mostly adds confidence – verification * One tangent altitude contains signal of interest, the other does not. Dr. J.J. Remedios, Atmos. Conf. ESRIN 2006
MIPAS SIGNATURES – ETHANE (C2H6) Green = real MIPAS spectrum Dr. J.J. Remedios, Atmos. Conf. ESRIN 2006
MIPAS Signatures – C2H6II Ethane MIPAS-ENVISAT MIPAS-B2 H. Sembhi, P. Meacham Dr. J.J. Remedios, Atmos. Conf. ESRIN 2006
MIPAS SIGNATURES: C2H6 III DS = 12 km – 21 km DS = 10 km – 21 km • DS = Diffference of real MIPAS spectrum at 10/12 km (high C2H6) with MIPAS spectrum at 21 km (low C2H6). J = Jacobian (1% change in concentration of C2H6 at tangent altitude) • Correlate DS with J (spectral shape!) • Assess significance with Students t-test. Dr. J.J. Remedios, Atmos. Conf. ESRIN 2006
NERC Molecular Spectroscopy Facility (RAL) • NERC Molecular Spectroscopy Facility • Bruker IFS 120HR FT spectrometer. • 0.0015 cm-1 spectral resolution(best available in the UK!) • Samples are prepared on vacuum lines/flow tubes and transferred to gas cells in the optical path of the spectrometer. Dr. J.J. Remedios, Atmos. Conf. ESRIN 2006
Experimental Details • Measurements were recorded at the Molecular Spectroscopy Facility at the Rutherford Appleton Laboratory in the UK. • Bruker IFS120HR FTS • Globar source, KBr beamsplitter, liquid-N2 cooled MCT detector • Stainless steel sample cell with an optical path difference of 26.1cm • Spectral Range: 600 –1800cm-1 • Resolution: mainly 0.03cm-1 • Temperature Range: 6 temperatures between 298 and 214K • Pressures: • Pure acetone (normally 0.5-2.5Torr) • Air-broadened to 150Torr, 375Torr, and 600-700Torr Dr. J.J. Remedios, Atmos. Conf. ESRIN 2006
ACETONE CROSS-SECTIONS Alison Waterfall Dr. J.J. Remedios, Atmos. Conf. ESRIN 2006
PAN CROSS-SECTION AT 296 K NEW LAB DATA HANST DATA G. Allen Dr. J.J. Remedios, Atmos. Conf. ESRIN 2006
PAN Spectroscopy – T dependence Allen, G., Remedios, J. J., Newnham, D. A., Smith, K. M., and Monks, P. S.: Improved mid-infrared cross-sections for peroxyacetyl nitrate (PAN) vapour, Atmos. Chem. Phys., 5, 47-56, 2005. Allen, G., Remedios, J. J., and Smith, K. M.: Low temperature mid-infrared cross-sections for peroxyacetyl nitrate (PAN) vapour. Submitted to Atmos. Chem. Phys.Disc. June 2005. Dr. J.J. Remedios, Atmos. Conf. ESRIN 2006
ORGANIC COMPOUND DETECTION (METHOD) • For MIPAS, heavy trace organic compounds (e.g. PAN) have typically weak infrared absorption signatures in the atmosphere and can only be found by analysis of weak residual spectra (typically 5% of total signal)! • ΔY = Measured (MIPAS) –– Simulated (without target gas) • ΔF =Simulated (with target gas) — Simulated (without) • Comparison of ΔYvs.ΔF can reveal characteristic absorption features of the target gas even when its contribution is a small fraction of the total signal • Accuracy requires good fitting of all other major and trace species in the spectral region of interest (e.g. H2O, CO2 etc. + aerosol) as well as P/T: • Want to look at the residuals resulting after removing the signals due to retrieved gas concentrations, e,g, in the tropics Dr. J.J. Remedios, Atmos. Conf. ESRIN 2006
DETECTION RESULTS (PAN): G. Allen Left: ΔY (black) overplotted with ΔF (red) for the 794 cm-1 PAN band fitted for 490 pptv PAN at 10.9 km. Below: Close up of above between 775 – 810 cm-1 with ΔYshifted by -200 nW. Above: ΔY + ΔF for the 1163 cm-1 PAN band also fitted for 490 pptv PAN at 10.9 km. Simultaneous detection of 2PAN bands in separate measurement channels with the same fitted concentrations provide confirmation of detection and accuracy of inferred PAN concentrations. Dr. J.J. Remedios, Atmos. Conf. ESRIN 2006
DETECTION RESULTS (OTHER ORGANICS) FORMIC ACID (620 pptv) 11 km ACETONE (540 pptv) 11 km Dr. J.J. Remedios, Atmos. Conf. ESRIN 2006
MIPAS SIGNATURES – Formic acid SPECTRUM BLACK=MEASUREDRED=SIMULATION RESIDUAL BLACK=MEASUREDBLUE=SIMULATED Dr. J.J. Remedios, Atmos. Conf. ESRIN 2006
PAN concentrationsG. Allen Mediterranean Sea East China Sea 9 km 12 km Dr. J.J. Remedios, Atmos. Conf. ESRIN 2006
ORGANICS IN CHINA OUTFLOW [MIPAS] PAN 450 pptv PAN, 1450 pptv acetone, 1.2 ppbv formic acid in China outflow Formic Acid Acetone Dr. J.J. Remedios, Atmos. Conf. ESRIN 2006
Organics Summary • New PAN spectral reference data have been used to detect clear and characteristic spectral signatures of PAN; detected simultaneously for two separate PAN bands in the mid-IR in two independent MIPAS spectral channels • PAN concentrations in the UT (8-15 km) have been retrieved from the best-fit to MIPAS spectral residuals with correlated concentrations inferred for both PAN bands • Clear signatures also observed for acetone and formic acid • Limits of detection by MIPAS are calculated to be: PAN: 60 pptv (9-15 km) = Detectable at NH background concentrations Acetone: 240 pptv (9-12 km) = Detectable near background concentrations and in polluted airmasses Formic acid: 120 pptv (9-15 km) = Detectable near source regions (high rainout) – BUT SPECTROSCOPY!! • Typical background concentrations of PAN have been observed in the UT over the Mediterranean during April 2003 and enhanced concentrations over the East China Sea. Acknowledgments to NERC for funding and ESA for MIPAS data provision Dr. J.J. Remedios, Atmos. Conf. ESRIN 2006