Download
1 / 3
30 likes | 210 Views
A. D. B. E. C. F. Fig. S1: Decay-Associated Difference Spectra (DADS) of (A) P3 PAS-GAF; (B) P3 D216A; (C) P3 PAS-GAF-PHY (reproduced from ref 11); (D) P2 PAS-GAF; (E) P2 D202A; (F) P2 PAS-GAF-PHY (reproduced from ref 11). B. A. D. C.

E N D
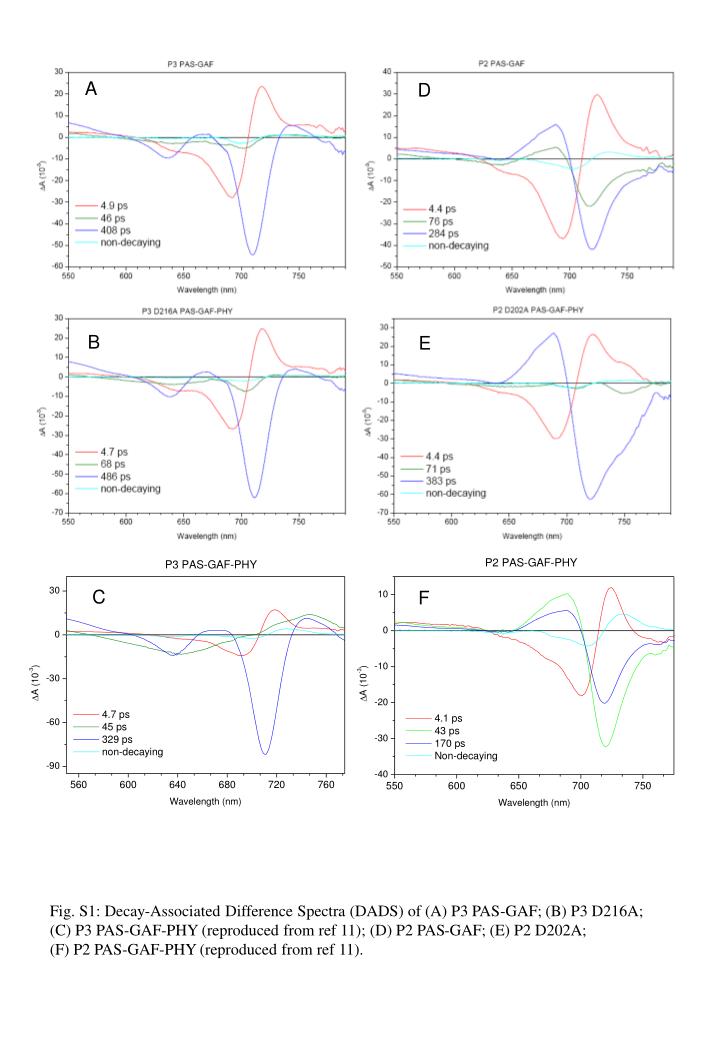
A D B E C F Fig. S1: Decay-Associated Difference Spectra (DADS) of (A) P3 PAS-GAF; (B) P3 D216A; (C) P3 PAS-GAF-PHY (reproduced from ref 11); (D) P2 PAS-GAF; (E) P2 D202A; (F) P2 PAS-GAF-PHY (reproduced from ref 11).
B A D C Fig. S2: Time-resolved fluorescence on P3 and P2 PAS-GAF. (A) Decay-associated spectrum (DAS) of P3 PAS-GAF ; (B) kinetic traces at 714 nm of P3 PAS-GAF in H2O (black) and D2O (red). (C) DAS of P2 PAS-GAF; (D) kinetic traces at 720 nm of P2 PAS-GAF in H2O (black) and D2O (red).
Fig. S3: Decay-Associated Difference Spectra (DADS) of the P3 Y272F PAS-GAF-PHY mutant