Download
1 / 100
1.21k likes | 1.68k Views
Obtaining an NMR Spectra. Basic Requirements : NMR sample: compound of interest dissolved in 500-600 m l of deuterated solvent. Higher the concentration higher the sensitivity Magnet: differentiate spin states (aligned/unaligned).

E N D
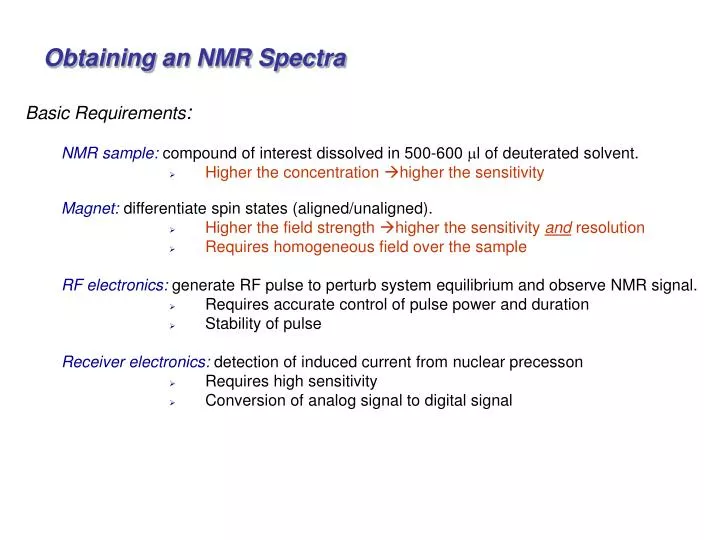
Obtaining an NMR Spectra Basic Requirements: NMR sample: compound of interest dissolved in 500-600 ml of deuterated solvent. • Higher the concentration higher the sensitivity Magnet: differentiate spin states (aligned/unaligned). • Higher the field strength higher the sensitivity and resolution • Requires homogeneous field over the sample RF electronics: generate RF pulse to perturb system equilibrium and observe NMR signal. • Requires accurate control of pulse power and duration • Stability of pulse Receiver electronics: detection of induced current from nuclear precesson • Requires high sensitivity • Conversion of analog signal to digital signal
Superconducting Magnet • solenoid wound from superconducting niobium/tin or niobium/titanium wire • kept at liquid helium temperature (4K), outer liquid N2 dewar near zero resistance minimal current lose magnet stays at field for years without external power source Cross-section of magnet magnet spinner sample lift NMR Tube RF coils cryoshims shimcoils Probe Superconducting solenoid Use up to 190 miles of wire! Liquid N2 Liquid He
NMR Sample Factors to Consider: • Maximize sample concentration • Avoid precipitation or aggregation • Use a single deuterated solvent • Reference for lock • Avoid heterogeneous samples distorts magnetic field homogeneity • Avoid air bubbles, suspended particles, sample separation • Avoid low quality NMR tubes distorts magnetic field homogeneity • Breaks easily damage the NMR probe • Chose appropriate temperature for the sample • Freezing or boiling the sample may break the NMR tube and damage the NMR probe. • Properly position NMR sample in the magnet • Position sample in homogeneous region of magnet and between detection and RF coils • Avoid positioning meniscus close to coil edge distorts magnetic field homogeneity Frequency of absorption:n = g Bo / 2p
Superconducting Magnet • Problems: • Field drifts (B0 changes) Field Drift over 11 Hrs (~ 0.15Hz/hr n = gBo/2p Remember:
Lock System • Need to constantly correct for the field drift during data collection • NMR probes contains an additional transmitter coil tuned to deuterium frequency changes in the intensity of the reference absorption signal controls a feedback circuit; a frequency generator provides a fixed reference frequency for the lock signal if the observed lock signal differs from the reference frequency, a small current change occurs in a room-temperature shim coil (Z0) to create a small magnetic field to augment the main field to place the lock-signal back into resonance Lock Feedback Circuit Lock Changes From Off-resonance to On-resonance
Lock System Simply, the lock system can be considered as a separate NMR spectrometer that is constantly collecting a deuterium spectrum and making sure the peak doesn’t move relative to a defined chemical shift
Lock System – things to consider • Measures the resonance of the deuterated solvent • a number of common solvents (D2O, methanol, chloroform) have known deuterium resonance • Can only lock on one resonance, defined by user. • Multiple deuterium resonances may confuse lock in automated acquisition • NMR sample needs to contain at least 5-10% volume of a deuterated solvent Consequence of locking wrong solvent – wrong chemical shifts and missing peaks!
Lock System – things to consider • Maximize lock signal indicates on-resonance • Use lock signal to shim sample • Loss of lock during experiment is problematic data not reliable • NMR sample degraded • Instrument problem • Started with weak lock signal • Increase lock signal by increasing lock gain • Amplification of the detected lock signal • Increases both signal and noise, so higher lock gain noisier lock signal • Increase lock signal by increasing lock power • Strength of RF pulse to detect lock signal • Too high and lock signal is saturated intensity of lock signal fluctuates up and down • Too low and lock signal may not be observable
Superconducting Magnet • Problems: • Field is not constant over sample (spatial variation) n = gBo/2p Again:
Magnetic Field Homogeneity Frequency of absorption:n = g Bo / 2p Good Homogeneity single peak with frequency dependent on Bo Poor Homogeneity multiple peaks at different effective Bo Resonance depends on position in NMR sample
Shim System • Corrects for magnetic inhomogeneity • Spatial arrangement of 20 or more coils • change current in each coil to “patch” differences in field and fix distortions in peak shape actual shim coils Sketch of shim coils
Shim Coils • electric currents in the shim coils create small magnetic fields which compensate for inhomogenieties in the magnet • shim coils vary in the geometric orientation and function (linear, parabolic, etc) • Z0,Z1,Z2,Z3,Z4,Z5 • X, XZ,XZ2,X2Y2,XY,Y,YZ, YZ2,XZ3,X2Y2Z, YZ3,XYZ,X3,Y3
Shim Coils • Optimize shims by i) minimizing line-width, ii) maximizing lock signal or iii) maximizing FID • Examples of poor line-shapes due to shimming errors
Shim Coils • Examples of poor line-shapes due to shimming errors
Shim Coils • Examples of poor FID shape due to shimming errors Mis-shimmed Magnet Perfectly Shimmed Magnet
Spinning the Sample • Improves effective magnetic field homogeneity by averaging inhomogeneities in the magnet • Z – shims are also known as spinning shims • Spinning the sample causes symmetric side-bands at intervals related to spinning rate • Non-spinning shims (X,Y) problems • Samples are never spun for multi-dimensional NMR experiments • Creates artifacts streaks or T1 ridges from spinning side-bands and spinning instability Spinning side-bands symmetric about peak
Gradient Shimming • Use pulse field gradients to automate the shimming (TopShim) • Gradients - spatial changes to B0 • Gradients are used to probe (map) the Field (B0) profile • A Shim Map is unique to each probe • Requires a Strong Signal (Solvent) • Requires H2O+D2O, CH3CN+D2O or CH3OH+D2O solvent Shim Map
Gradient Shimming • Two General Approaches to Gradient Shimming • 1D gradshim (Z-shims) seconds to minutes • 3D gradient shimming (all shims) 5 to 30 minutes • Shimming is accomplished by matching gradient shims for your sample to shim map Gradient shim (red) fit to shim map
Gradient Shimming Water resonance before and after Gradient Shimming Gradient Shimming
Environment Stability • Changes in the environment during data acquisition may have strong negative impacts on the quality of the NMR data • Common causes of spectra artifacts are: • Vibrations (building, HVAC, etc) • Temperature changes • The longer the data acquisition, the more likely these issues will cause problems • The lower the sample concentration (lower S/N) the more apparent these artifacts will be Noise peaks due to building vibrations
Environment Stability Peak Chemical Shift and Shape Change as Temperature Changes
Sample Probe • Holds the sample in a fixed position in the magnetic field • Contains an air turbine to spin, insert and eject the sample • Contains the coils for: • transmitting the RF pulse • detecting the NMR signal • observing the lock signal • creating magnetic field gradients • Thermocouples and heaters to maintain a constant temperature
Sample Probe Important to note, because of the high magnetic field, the probe has to be built with non-magnetic material such as glass and plastics. Thus, probes tend to be fragile and easy to break
Tuning the Probe • Placing the sample into the probe affects the probe tuning • Solvent, buffers, salt concentration, sample concentration and temperature all have significant impact on the probe tuning • Probe is tuned by adjusting two capacitors: match and tune • Goal is to minimize the reflected power at the desired frequency • Tuning capacitor changes resonance frequency of probe • Matching capacitor matches the impedance to a 50 Ohm cable Power submitted to transmitter and receiver is maximized
Tune and Match System • Tune- corrects the differences between observed and desired frequency • Match – correct impedance difference between resonant circuit and transmission line (should be 50W ) • Adjust two capacitors until the tuning and desired frequency match and you obtain a null Affects: signal-to-noise accuracy of 90o pulse sample heating chemical shift accuracy
Tune and Match System • Tune and Match capacitors for a Bruker Probe
Tune and Match System • Changing the Distance Between the Plates or the • Amount of Plate Surface Area which overlaps in a Variable Capacitor Physical limits to how far the capacitor can be turned in either direction. If turned too far will easily break!!
Tuning the Probe • Side Notes: Impedance • Impedance – any electrical entity that impedes the flow of current • a resistance, reactance or both • Resistance – material that resists the flow of electrons • Reactance – property of resisting or impeding the flow of ac current or ac voltage in inductors and capacitors • Illustration of matching impedance • Consider a 12V car battery attached to a car headlight • 12V car battery – low impedance high power • Consider 8 1.5V AA batteries (12 volt total) attached to a very low wattage light bulb • 8 1.5V AA batteries – high impedance low power • Now swap the arrangement What happens? • Car battery can easily light the light bulb, but the headlight will quickly drain the AA batteries poor impedance match
Tuning the Probe • Side Notes: Quality factor (Q) • “Q” - dimensionless and important property of capacitors and inductors • Q - frequency of the resonant circuit divided by the half power bandwidth • All inductors exhibit some extra resistance to ac or rf • Q is the reactance of the inductor divided by this ac or rf resistance • NMR probes Q > 300 • Higher the probe Q the greater the sensitivity • High Q for an NMR probe is required for high Signal-to-Noise • Sample can effect the Q of the probe • The sample increases losses in the resonant circuit by inducing eddy currents in the solvent • The more conductive the sample the more the losses and the lower the probe Q. • Water, high salt lower the Q of the probe • Lower Q longer pulse widths X – reactance of circuit in Ohms RL – the series resistance of the circuit in Ohms
Pulse Generator & Receiver System • Radio-frequency generators and frequency synthesizers produce a signal at essentially a single frequency. • RF pulses are typically short-duration (msecs) - produces bandwidth (1/4t) centered around single frequency - shorter pulse width broader frequency bandwidth • Heisenberg Uncertainty Principal:Du.Dt ~ 1/2p - Shortest pulse length will depend on the probe Q and the sample property * = tp Pulse length (time, tp) FT A radiofrequency pulse is a combination of a wave (cosine) of frequency wo and a step function The Fourier transform indicates the pulse covers a range of frequencies
Maximum affect Null, no affect Invert signal, 180o pulse • Pulse Generator & Receiver System • RF pulse width determines band-width of excitation • - Not a flat profile • - All nuclei within ±1/4PW Hz will be equally affected • 1H 6 ms 90o pulse ±41666 Hz ±69.4 ppm at 600 MHz • Minimizes weaker perturbations of spins a edges of spectra • - There are also null points at ±1/PW Hz where nuclei are unperturbed • 1H 6 ms 90o pulse first null at ±1.67e5 Hz ±277.8 ppm at 600 MHz
Maximum affect Null, no affect Invert signal, 180o pulse • Pulse Generator & Receiver System • RF pulse width determines band-width of excitation • - These issues become a problem at high magnetic field strengths (800 & 900 MHz) for 13C spectra that that have a large chemical shift range (>200 ppm) • 13C 15 ms 90o pulse ±16666 Hz ±18.5 ppm at 900 MHz • Also, complex experiments (multiple pulses) depend on the accuracy and consistency of pulse widths • - Selective pulse long pulse width (ms) narrow band-width.
Pulse Length Calibration • Need to experimentally determine 90o pulse • - Measure intenisty of major peak (solvent) in spectrum as the function of 90o pulse length (P1) • Maximum at 900 and minimum at 360o • Usually measure 90o pulse at 360o time point
Pulse Length Calibration 90o pulse (12 ms) 180o pulse (24 ms) 360o pulse (44 ms) The pulse width was arrayed from 2 ms to 60 ms in steps of 2 ms 90o pulse is ~ 11 ms 270o pulse (32 ms)
Pulse Generator & Receiver System • A magnetic field perpendicular to a circular loop will induce a current in the loop. • 90o NMR pulses places the net magnetization perpendicular to the probe’s receiver coil resulting in an induced current in the nanovolt to microvolt range • preamp mounted in probe amplifies the current to 0 to 10 V • no signal is observed if net magnetization is aligned along the Z or –Z axis Rotates at the Larmor frequency n = gBo/2p
Continuous Wave (CW) vs. Pulse/Fourier Transform Continuous Wave – sweep either magnetic field or frequency until resonance is observed • absorbance observed in frequency domain Pulse/Fourier Transform – perturb and monitor all resonances at once – absorbance observed in the time domain
Continuous Wave (CW) vs. Pulse/Fourier Transform NMR Sensitivity Issue A frequency sweep (CW) to identify resonance is very slow (1-10 min.) Step through each individual frequency. Pulsed/FT collect all frequencies at once in time domain, fast (N x 1-10 sec) All modern spectrometers are FT-NMRs
Continuous Wave (CW) vs. Pulse/Fourier Transform Fourier Transform NMR • Observe each individual resonance as it precesses at its Larmor frequency (wo) in the X,Y plane. • Monitor changes in the induced current in the receiver coil as a function of time. FID – Free Induction Decay
Fourier Transform NMR • Signal-to-noise increases as a function of the number of scans or transients • Increases data collection time • There are inherent limits: • Gain in S/N will eventually plateau • The initial signal has to be strong enough to signal average. Increase signal-to-noise (S/N) by collecting multiple copies of FID and averaging signal.
Fourier Transform NMR Increase signal-to-noise (S/N) by collecting multiple copies of FID and averaging signal. But, total experiment time is proportional to the number of scans exp. time ~ (number of scans) x (recycle delay; D1)
Fourier Transform NMR • Recycle time (D1) – time increment between successive FID collection • Maximum signal requires waiting for the sample to fully relax to equilibrium (5 x T1) • T1 – NMR relaxation parameter that will be discussed in detail later in the course • Most efficient recycle delay is 1.3 x T1 Relative S/N per unit time of data collection 1.3T1 Repetition time (tT/T1) Optimize your repetition time …
Fourier Transform NMR • Recycle time (D1) – time increment between successive FID collection • Typical T1’s for organic compounds range from50 to 0.5 seconds • T1 relaxation times also vary by nuclei, where 13C > 1H • Either estimates from related compounds or experimental measurements of T1 is required to optimize data collection especially for long data acquisitions.
Continuous Wave (CW) vs. Pulse/Fourier Transform Fourier Transform NMR • NMR signal is collected in Time Domain, but prefer Frequency Domain • Transform from time domain to frequency domain using the Fourier function Fourier Transform is a mathematical procedure that transforms time domain data into frequency domain
Sampling the NMR (Audio) Signal • Collect Digital data by periodically sampling signal voltage • ADC – analog to digital converter Continuous FID Digitized FID
Sampling the NMR (Audio) Signal • Collect Digital data by periodically sampling signal voltage • ADC – analog to digital converter Sample intensity of voltage induced in coil by y-vector of net magnetization precessing in x,y-plane
Sampling the NMR (Audio) Signal • To correctly represent Cos/Sin wave, need to collect data at least twice as fast as the signal frequency • If sampling is too slow, get folded or aliased peaks The Nyquist Theorem says that we have to sample at least twice as fast as the fastest (higher frequency) signal. Sample Rate - Correct rate, correct frequency SR = 1 / (2 * SW) • ½ correct rate, ½ correct frequency Folded peaks! Wrong phase! SR – sampling rate SW – sweep width
Digital Resolution – number of data points The FID is digitized Equal delay between points (dwell time) DT = 1 / (2 * SW) Want to maximize digital resolution, more data points increases acquisition time (AQ) and experimental time (ET): AQ = DT x NP ET = AQ x NS larger spectral width (SW) requires more data points for the same resolution
Sampling the NMR (Audio) Signal Sweep width (Hz, ppm) needs to be set to cover the entire NMR spectra Sweep Width (range of radio-frequencies monitored for nuclei absorptions) If SW is too small or sampling rate is too slow, than peaks are folded or aliased (note phase change)
Sampling the NMR (Audio) Signal SW is decreased The phase of folded peaks can vary: (a) negative phase, (b) dispersive or (c) positive phase.