Download
1 / 72
720 likes | 932 Views
De Novo Sequencing of MS Spectra. Only a manually confirmed spectrum is a correct spectrum Beatrix Ueberheide February 25 th 2014. Biological Mass Spectrometry. Proteolytic digestion. Peptides. Protein(s). Base Peak Chromatogram. MS. 500. 1000. 1500. m/z. Time (min).

E N D
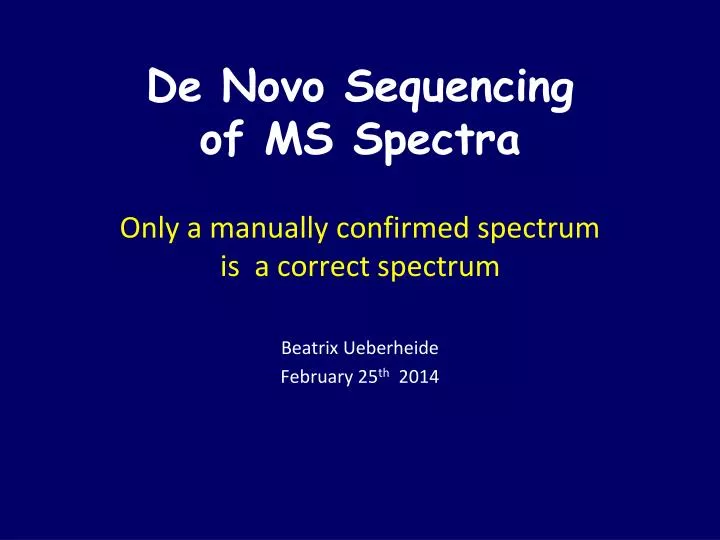
De Novo Sequencing of MS Spectra Only a manually confirmed spectrum is a correct spectrum Beatrix Ueberheide February 25th 2014
Biological Mass Spectrometry Proteolytic digestion Peptides Protein(s) Base Peak Chromatogram MS 500 1000 1500 m/z Time (min) Mass Spectrometer MS/MS Database Search Manual Interpretation 200 600 1000 m/z
Peptide Sequencing using Mass Spectrometry S G F L E E D E L K 100 % Relative Abundance 0 250 500 750 1000 m/z
Peptide Sequencing using Mass Spectrometry 88 145 292 405 534 663 778 907 1020 1166 b ions S G F L E E D E L K 100 % Relative Abundance 0 250 500 750 1000 m/z
Peptide Sequencing using Mass Spectrometry S G F L E E D E L K 1166 1080 1022 875 762 633 504 389 260 147 y ions 100 % Relative Abundance 0 250 500 750 1000 m/z
Peptide Sequencing using Mass Spectrometry 88 145 292 405 534 663 778 907 1020 1166 b ions S G F L E E D E L K 1166 1080 1022 875 762 633 504 389 260 147 y ions 762 100 875 [M+2H]2+ % Relative Abundance 633 292 405 534 1022 260 389 504 907 1020 663 778 1080 0 250 500 750 1000 m/z
Peptide Sequencing using Mass Spectrometry 88 145 292 405 534 663 778 907 1020 1166 b ions S G F L E E D E L K 1166 1080 1022 875 762 633 504 389 260 147 y ions 762 113 100 875 113 [M+2H]2+ % Relative Abundance 633 292 405 534 1022 260 389 504 907 1020 663 778 1080 0 250 500 750 1000 m/z
Peptide Sequencing using Mass Spectrometry 88 145 292 405 534 663 778 907 1020 1166 b ions S G F L E E D E L K 1166 1080 1022 875 762 633 504 389 260 147 y ions 762 100 129 875 [M+2H]2+ % Relative Abundance 129 633 292 405 534 1022 260 389 504 907 1020 663 778 1080 0 250 500 750 1000 m/z
Peptide Sequencing using Mass Spectrometry 88 145 292 405 534 663 778 907 1020 1166 b ions S G F L E E D E L K 1166 1080 1022 875 762 633 504 389 260 147 y ions 762 100 875 [M+2H]2+ % Relative Abundance 633 292 405 534 1022 260 389 504 907 1020 663 778 1080 0 250 500 750 1000 m/z
Peptide Sequencing using Mass Spectrometry 88 145 292 405 534 663 778 907 1020 1166 b ions S G F L E E D E L K 1166 1080 1022 875 762 633 504 389 260 147 y ions 762 100 875 [M+2H]2+ % Relative Abundance 633 292 405 534 1022 260 389 504 907 1020 663 778 1080 0 250 500 750 1000 m/z
Peptide Sequencing using Mass Spectrometry 88 145 292 405 534 663 778 907 1020 1166 b ions S G F L E E D E L K 1166 1080 1022 875 762 633 504 389 260 147 y ions 762 100 875 [M+2H]2+ % Relative Abundance 633 292 405 534 1022 260 389 504 907 1020 663 778 1080 0 250 500 750 1000 m/z
How to Sequence: CAD Residue Mass (RM) The very first N- and C-terminal fragment ions are not just their corresponding residue masses. The peptides N or C-terminus has to be taken into account. b ion y ion b1 = RM + 1 y1 = RM + 19
Example of how to calculate theoretical fragment ions 88 159 290 387 500 629 803 S A M P L E R 803 716 645 514 417 304 175 Residue Mass The first b ion The first y ion
How to calculate theoretical fragment ions RM+1 + RM + RM + RM + RM + RM +RM+18 88 159 290 387 500 629 803 S A M P L E R 803 716 645 514 417 304 175 + RM + RM + RM + RM + RM + RM RM+19 The first b ion The first y ion Residue Mass
Finding ‘pairs’ and ‘biggest’ ions If trypsin was used for digestion, one can assume that the peptide terminates in K or R. Therefore the biggest observable b ion should be: Mass of peptide [M+H] +1 -128 (K) -18 Mass of peptide [M+H] +1 -156 (K) -18 y ions are truncated peptides. Therefore subtract a residue mass from the parent ion [M+H] +1 . The highest possible ion could be at [M+H] +1 -57 (G) and the lowest possible ion at [M+H] +1 -186 (W) b and y ion pairs: Complementary b and y ions should add up and result in the mass of the intact peptide, except since both b and y ion carry 1H+ the peptide mass will be by 1H+ too high therefore: b (m/z) + y (m/z)-1 = [M+H] +1 Check the SAMPLER example
How to start sequencing • Know the charge of the peptide • Know the sample treatment (i.e. alkylation, other derivatizations that could change the mass of amino acids) • Know what enzyme was used for digestion • Calculate the [M+1H]+1 charge state of the peptide • Find and exclude non sequence type ions (i.e. unreacted precursor, neutral loss from the parent ion, neutral loss from fragment ions • Try to see if you can find the biggest y or b ion in the spectrum. Note, if you used trypsin your C-terminal ion should end in lysine or arginine • Try to find sequence ions by finding b/y pairs • You usually can conclude you found the correct sequence if you can explain the major ions in a spectrum
Common observed neutral losses and mass additions: • Ammonia -17 • Water -18 • Carbon Monoxide from b ions -28 • Phosphoric acid from phosphorylated serine and threonine-98 • Carbamidomethyl modification on cysteines upon alkylation with iodoacetamide+57 • Oxidation of methionine+18 Calculate with nominal mass during sequencing, but use the monoisotopic masses to check if the parent mass fits. For high res. MS/MS check that the residue mass difference is correct.
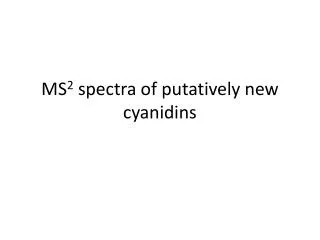
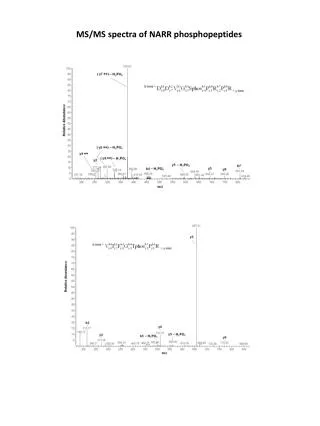
Mixed Phospho spectra unmodified 1 Phospho site 1 Phospho site
First ‘on your own example’ Remember what you need to know first!
What is the charge state? Neutral loss of water Water = 18; 18/z; 9 • Neutral loss of water? • Any ions about (z * parent mass)? • Confirm with b/y pairs!
Search for ‘biggest ion’ 1433-18-RM 1433-18- aresidue after which an enzyme cleaves 1433-18-156 = 1249 1433-18-128 = 1297
1297 1433 K 147
1210 1297 1433 S K 87 1433 234 147
Find the biggest y ion! Peptide Mass – RM Lowest possible ion = Glycine Highest possible ion = Tryptophan Glycine = 1443-57 = 1386 Tryptophan = 1443-186 = 1257 164 1210 1297 1433 Y S K 87 1433 1280 234 147 1443-163 = 1280
What is the difference ? Less b ions A bit of precursor is left Accurate mass
+ Electron Transfer Dissociation
Tandem MS - Dissociation Techniques CAD: Collision Activated Dissociation (b, y ions) increase of internal energy through collisions ETD: Electron Transfer Dissociation (c, z ions) bombardment of peptides with electrons (radical driven fragmentation)
The Prototype Instrument Modified rear / CI source HPLC LTQ front
- Ion Detector 1 0f 2 Modifications For Ion/Ion Experiments Anion Precursor (Fluoranthene) Three Section RF Linear Quadrupole Trap Filament e- Cations NICI Source 3 mTorr He Anions + From ESI Source ~700 mTorr Methane Secondary RF Supply 0-150 Vpeak @ 600 kHz
Charge-Sign Independent Trapping Positive and negative ions react while trapped in axial pseudo-potential Pseudo- potential created by +150 Vp 600 kHz applied to lenses + 0 V -
- + Charge sign independent radial confinement 0 V Axial Confinement With DC Potentials Trapping is Charge Sign Dependent
Charge sign independent axial confinement with combined RF Quadrupole and end lens RF pseudo-potentials + 0 V -
End ion/ion reactions prepare for product ion analysis Product Cations Trapped in Center Section For Scan Out + + + + + 0 V -12 V - - Reagent Anions Removed Axially
Fragmentation(ETD) Electron Transfer - Proton Transfer +3 Precursor 100 50 0 200 400 600 800 1000 1200 1400 m/z
Fragmentation(ETD) - O O Electron Transfer - Proton Transfer +3 Precursor 100 50 0 200 400 600 800 1000 1200 1400 m/z Charge Reduction (PTR) 100 +2 +2 +3 Precursor +1 +1 50 0 200 400 600 800 1000 1200 1400 m/z
Intact Charge-Reduced Products [M + 3H]2+• ET or ETD [M + 3H]2+• Mass ? m/z ? Charge (z) Sequence ? Temperature ? Anion ? He Pressure? Fragmentation Products c, z, etc.
Intact Charge-Reduced Products [M + 3H]2+• ET or ETD [M + 3H]2+• Mass ? m/z ? Charge (z) Sequence ? Temperature ? Anion ? He Pressure? Fragmentation Products c, z, etc. CAD