Download
1 / 55
550 likes | 554 Views
Table 5.1.1: Stock and Flow of Renal Transplantation, 1997-2006. New patients. Functioning graft at 31 st Dec. 1800. 1600. 1400. 1200. 1000. No. of patients. 800. 600. 400. 200. 0. 1975. 1977. 1979. 1981. 1983. 1985. 1987. 1989. 1991. 1993. 1995. 1997. 1999. 2001.

E N D
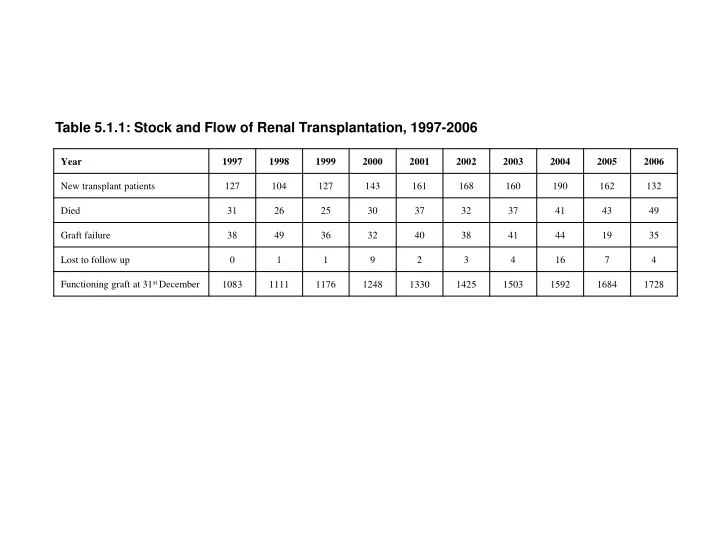
Table 5.1.1: Stock and Flow of Renal Transplantation, 1997-2006
New patients Functioning graft at 31st Dec 1800 1600 1400 1200 1000 No. of patients 800 600 400 200 0 1975 1977 1979 1981 1983 1985 1987 1989 1991 1993 1995 1997 1999 2001 2003 2005 Year Figure 5.1.1: Stock and Flow of Renal Transplantation, 1975-2006
Table 5.1.2: New Transplant Rate per million population (pmp), 1997-2006
10 9 8 7 6 New Transplant rate, pmp 5 4 3 2 1 0 1975 1977 1979 1981 1983 1985 1987 1989 1991 1993 1995 1997 1999 2001 2003 2005 Year Figure 5.1.2: New Transplant Rate, 1975-2006
Table 5.1.3: Transplant Prevalence Rate per million population (pmp), 1997-2006
70 65 60 55 50 45 40 Transplant Prevalence Rate, pmp 35 30 25 20 15 10 5 0 1975 1977 1979 1981 1983 1985 1987 1989 1991 1993 1995 1997 1999 2001 2003 2005 Year Figure 5.1.3: Transplant Prevalence Rate, 1975-2006
Table 5.2.1: Renal Transplant Recipients’ Characteristics, 1997-2006
Table 5.2.2: Primary Causes of End Stage Renal Failure, 1997-2006
Table 5.3.1: Type of Renal Transplantation, 1997-2006 *Commercial Cadaver (China, India, other oversea) *Commercial live donor (living unrelated) *Cadaver (local)
Table 5.4.1: Post Transplant Complications , 2004-2006 * Hypertension: BP systolic > 140 and BP diastolic > 90 mmHg OR had either Beta blocker / Calcium channel blocker / ACE inhibitor / AIIRB / Other anti-hypertensive
Table 5.4.2: Transplant Patients Death Rate and Graft Loss, 1997-2006 *Graft loss=graft failure *All losses=death / graft loss (acute rejection happens concurrently with graft failure / death)
70 60 50 40 Death rate (%) 30 20 10 0 1993 1975 1977 1979 1981 1983 1985 1987 1989 1991 1995 1997 1999 2001 2003 2005 Year Figure 5.4.2(i): Transplant Recipient Death Rate, 1975-2006
18 16 14 12 10 Graft loss rate (%) 8 6 4 2 0 1975 1977 1979 1981 1983 1985 1987 1989 1991 1993 1995 1997 1999 2001 2003 2005 Year Figure 5.4.2(ii): Transplant Recipient Graft Loss Rate, 1975-2006
Table 5.4.3: Causes of Death in Transplant Recipients, 1997-2006 Note: Some patients may have more than one cause of death.
Table 5.4.4: Causes of Graft Failure, 1997-2006 Some patients may have more than one cause of graft failure.
Table 5.5.1: Patient Survival, 1993-2006 SE=standard error
1.00 0.75 Cumulative survival 0.50 0.25 0.00 0 2 4 6 8 10 12 Duration in years Figure 5.5.1: Patient Survival, 1993-2006
Table 5.5.2: Graft survival, 1993-2006 SE=standard error
1.00 0.75 Cumulative survival 0.50 0.25 0.00 0 2 4 6 8 10 12 Duration in years Figure 5.5.2: Graft Survival, 1993-2006
Table 5.5.3: Patient Survival by Type of Transplant, 1993-2006 SE=standard error
1.00 Live donor Commercial cadaver Commercial live donor 0.75 Cumulative survival 0.50 Cadaver 0.25 0.00 0 2 4 6 8 10 12 Duration in years Figure 5.5.3: Patient Survival by Type of Transplant, 1993-2006
Table 5.5.4: Graft Survival by Type of Transplant, 1993-2006 SE=standard error
1.00 Commercial cadaver 0.75 Live donor Commercial live donor Cumulative survival 0.50 Cadaver 0.25 0.00 0 2 4 6 8 10 12 Duration in years Figure 5.5.4: Graft Survival by Type of Transplant, 1993-2006
Table 5.5.5: Patient Survival by Year of Transplant (Living Related Transplant, 1993-2006) SE=standard error
1.00 Year 1999-2006 Year 1993-1998 0.75 Cumulative survival 0.50 0.25 0.00 0 1 2 3 4 5 6 7 Duration in years Figure 5.5.5: Patient Survival by Year of Transplant (Living Related Transplant,1993-2006)
Table 5.5.6: Graft Survival by Year of Transplant (Living Related Transplant, 1993-2006) SE=standard error
1.00 Year 1999-2006 0.75 Year 1993-1998 Cumulative survival 0.50 0.25 0.00 0 1 2 3 4 5 6 7 Duration in years Figure 5.5.6: Graft Survival by Year of Transplant (Living Related Transplant, 1993-2006)
Table 5.5.7: Patient Survival by Year of Transplant (Commercial Cadaver Transplant, 1993-2006) SE=standard error
1.00 Year 1999-2006 Year 1993-1998 0.75 Cumulative survival 0.50 0.25 0.00 0 1 2 3 4 5 6 7 Duration in years Figure 5.5.7: Patient Survival by Year of Transplant (Commercial Cadaver Transplant, 1993-2006)
Table 5.5.8: Graft Survival by Year of Transplant (Commercial Cadaver Transplant,1993-2006) SE=standard error
1.00 Year 1999-2006 0.75 Year 1993-1998 Cumulative survival 0.50 0.25 0.00 0 1 2 3 4 5 6 7 Duration in years Figure 5.5.8: Graft Survival by Year of Transplant (Commercial Cadaver Transplant,1993-2006)
Table 5.6.1: Risk Factors for IHD in Renal Transplant Recipients at Year 2004,2005, and 2006 ** Hypertension: BP systolic > 140 and BP diastolic > 90 mmHg OR had either Beta blocker / Calcium channel blocker/ ACE inhibitor/ AIIRB / Other anti-hypertensive drugs GFR(mL/min/1.73m2) = 1.2*(140-age(year))* weight(kg) / creatinine(µmol/L) if male GFR(mL/min/1.73m2) = 0.85*(1.2*(140-age(year))* weight(kg) / creatinine(µmol/L) if female CKD stage III – GFR, 30- 60 mL/min CKD stage IV – GFR, 15- 30 mL/min CKD stage V – GFR, < 15 mL/min
Figure 5.6.1a: Venn Diagram for Pre and Post Transplant Complications (in %) at year 2004
9.3 1.3 35.2 9.2 1.2 10.4 33.4 Figure 5.6.1b: Venn Diagram for Pre and Post Transplant Complications (in %) at Year 2005 CKD Hypertension Diabetes
Figure 5.6.1c: Venn Diagram for Pre and Post Transplant Complications (in %) at Year 2006 CKD 12.1 1.2 33.4 10.0 1.4 31.4 10.4 Diabetes Hypertension
Table 5.6.2a: Distribution of Patients by Systolic BP Levels, 2004-2006
Systolic BP <120 Systolic BP <130 Systolic BP 130-139 Systolic BP 140-159 Systolic BP 160-179 Systolic BP >=180 100 90 80 70 Percentage of patients (%) 60 50 40 30 20 10 0 2004 2005 2006 Figure 5.6.2a: Distribution of Patients by Systolic BP Levels, 2004-2006 Year
Table 5.6.2b: Distribution of Patients by Diastolic BP Levels, 2004-2006
Diastolic BP <80 Diastolic BP <85 Diastolic BP 85-89 Diastolic BP 90-99 Diastolic BP 100-109 Diastolic BP ≥110 100 90 80 70 Percentage of patients (%) 60 50 40 30 20 10 0 2004 2005 2006 Year Figure 5.6.2b: Distribution of Patients by Diastolic BP Levels, 2004-2006
Table 5.6.3: Distribution of Patients by CKD Stages, 2004-2006
CKD Stage 1 CKD Stage 2 CKD Stage 3 CKD Stage 4 CKD Stage 5 100 90 80 70 60 Percentage of patients (%) 50 40 30 20 10 0 2004 2005 2006 Year Figure 5.6.3: Distribution of Patients by CKD Stages, 2004-2006
Table 5.6.4: Distribution of Patients by BMI Levels, 2004-2006
BMI <20 BMI 20-25 BMI 25-30 BMI >30 100 90 80 70 60 Percentage of patients (%) 50 40 30 20 10 0 2004 2005 2006 Year Figure 5.6.4: Distribution of Patients by BMI Levels, 2004-2006
Table 5.6.5a: Distribution of Patients by LDL Levels, 2004-2006
LDL <2.6 LDL 2.6-3.4 LDL >= 3.4 100 90 80 70 60 Percentage of patients (%) 50 40 30 20 10 0 2004 2005 2006 Year Figure 5.6.5a: Distribution of Patients by LDL Levels, 2004-2006
Table 5.6.5b: Distribution of Patients by Total Cholesterol Levels, 2004-2006