Download
1 / 27
270 likes | 278 Views
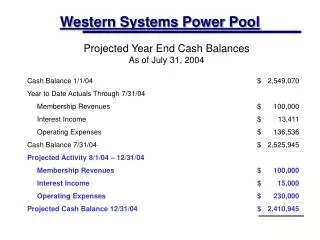
Southwest Power Pool ITP-20 Generating Resources. May 25, 2010. Agenda. Study Purpose and Scope Study Approach Resources Considered Base Case Results Questions. Study Purpose and Work Scope.

E N D
Southwest Power PoolITP-20 Generating Resources May 25, 2010
Agenda • Study Purpose and Scope • Study Approach • Resources Considered • Base Case Results • Questions B&V - 2
Study Purpose and Work Scope • Phase I. Develop resource plans for each of four future scenarios, as defined by the SPP System Planning Committee, to be used in the ITP Year 20 EHV analysis. The resources will be selected using an optimal generation expansion model, Strategist, configured to provide resource planning solutions on a regional basis. The resource list will be generic prototype generators representing available future resources. • Phase II. Spatially located the new resources within SPP with the aid of GIS databases showing locations of transmission lines, natural gas pipelines, railroads, waterways, substations, etc. • Phase III. The new generators will be entered into a PowerBase database and connected to buses in the transmission system. The information entered into the PowerBase will be used by SPP in future studies. B&V - 3
Study Approach B&V - 4
Review of Study Approach • Used Powerbase data model provided by SPP. • Developed capital cost and performance estimates for future candidate units. • Developed Annual Levelized Fixed Charge Rates to apply to capital cost estimated to account for financing costs, insurance, taxes, etc • Updated data model based on feedback from stakeholders. • Developed renewable energy build-out scenario. • SPP footprint divided into two areas due to model limits. • Developed least cost generation expansion using Ventyx Strategist. B&V - 5
Topology Review • SPP footprint broken down into two sub-regions because of Strategist dimension limits. • Initial attempt was to model the entire SPP in one model with 2 zones. But, encountered Strategist dimension limit. • SPP footprint modeled using two separate Strategist models for 2 sub-regions: SPP North (SPPN) and SPP South (SPPS) • Approximate dividing line – Kansas-Oklahoma State line • 200 MW of capacity flow from SPPS to SPPN was allowed until SPPS was not excess on capacity to meet their own load and reserve requirements. B&V - 6
SPP North (SPPN) Control Areas • Lincoln Electric System • NPPD • OPPD • City Utilities of Springfield, MO • Empire District Electric Company. • MKE • MWE • Greater Missouri Operations Company. • Independence Power and Light • Kansas City BPU • KCP&L • Westar Energy • Sunflower Electric Power Corp. B&V - 7
SPP South (SPPS) Control Areas • AEP West • OG&E • Western Farmers Electric Co-operative • Southwestern Public Service Company • Central Louisiana Electric Company • City of Lafayette • Louisiana Energy and Power Authority • GRDA • Southwestern Power Administration B&V - 8
Economic Inputs – Development of Fixed Charge Rate • Used a proprietary Black & Veatch model for development of FCR • Fixed Charge Rate (FCR) is used to estimate the annual capital carrying cost for new plants and for new capital improvements done on existing plants. • A levelized fixed charge rate is a single, uniform rate that is applied to a unit’s total installed capital cost to yield the revenue requirements needed to recover cost on a present value basis. FCR varies depending upon various economic and financial assumptions. • Black & Veatch model develops different FCR for IOU, and Municipal and Cooperative (M&C) utilities. • Blended FCR calculated for SPP to account for different types of LSE in SPP. Assumed an 80/20 mix of generating resources additions by IOUs/M&C. • Technology dependent unit lives were assumed for FCR calculations: peaking (20 years), combined cycle (25 years), coal/nuclear (30 Years), and wind (5 year tax life, assumes not M&C financed). B&V - 9
Fixed Charge Rate Assumptions for IOU Assumptions for Municipalities and Cooperatives • D/E ratio of 55:45 • 7 percent cost of debt and 12 percent cost of equity • 39 percent effective tax rate and 0.5 percent adder for insurance and property taxes • 20 tax life • 20 year FCR – 13.83 % • 25 year FCR – 12.74 % • Fully debt financed and tax exempted • 5.5 percent bond financing rate • 0.5 percent adder for insurance and property taxes • 20 year debt life FCR – 8.87 % • 25 year debt life FCR – 7.96 % Blended 20 year FCR and 25 year book life FCRs for SPP is 12.84% and 11.79% respectively. B&V - 10
Additional FCR Calculations • Calculated a single FCR for renewable resources assuming 5 year tax life and 20 year book life. • Assumed all investors are taxable due to preferential depreciation status • 11.53% • Calculated a blended FCR for coal and nuclear resources assuming 20 year tax life and 30 year book life. • 11.51% B&V - 11
Generating Resources Considered B&V - 12
Cost & Operating Assumptions for Conventional Alternatives B&V - 13
Different Conventional Prototypes Modeled in Strategist Baseload Resources • 2x1 Generic Combined Cycle with maximum capacity of about 600 MW • 800 MW Supercritical Pulverized Coal Unit without CCS • 1100 MW Nuclear Unit Peaking Resources • Generic frame CT with maximum capacity of about 200 MW In addition, wind resources for meeting RPS requirements were added. B&V - 14
Addition of Wind Resources • Wind Resource addition based on the Futures for Integrated Transmission Planning Process year 20 Assessment, Revision 3. • Business as Usual (Base case) wind additions assumes no RES requirements (as per Appendix 1 of the aforementioned document) • 42,000 GWh of renewable generation is achieved by 2020 for the whole SPP area • At 40 percent capacity factor, this equates to about 11.9 GW of nameplate capacity • Capacity value (Firm Capacity) of wind resources is assumed to be 5 percent of the name plate capacity. • Wind resources capital cost assumed to be $2,150/kw (2010 dollars) • Operating costs of wind resources assumed to be $51/kw-year. • All new wind resources to meet RPS are expected to be online by 2020. B&V - 15
Other Key Assumptions • Model run for 20 years (2011-2030, inclusive) • No potential CO2 taxes considered for the base case • Coal PRB price forecast – No change to Ventyx forecast. • NG price forecast – HH forecast from Ventyx. Basis differentials updated base on SPP stakeholder feedback. • Uranium prices – Ventyx forecast updated based on stakeholder feedback. • Units are allowed to be added in intervals of 2/3 years, with the intervals increasing from 2 years to 4 years as we move further out into the study period. • 200 MW of capacity is allowed to flow from SPPS to SPPN from 2010-2022 as SPPS has excess capacity at this time. B&V - 17
Wind Profile Data Collection Methodology • EWITS and WWSIS data • Mesoscale modeled data • Modeled years are 2004, 2005, 2006 • Used year 2005 profile because that year was judged as the best representative year. • 10 minute data translated into 8760 hourly observations • Information presented in capacity factor (%) units • Profiles scaled accordingly to incorporate additional capacity factor information from actual project data B&V - 18
Base Case Results B&V - 19
Reserve Margin with No New Units – NPPN (Preliminary) B&V - 20
Reserve Margin with No New Units – SPPN (Preliminary) B&V - 21
Reserve Margin with No New Units – Whole SPP (Preliminary) B&V - 22
Expansion Plan – NPPN (Preliminary) B&V - 23
Expansion Plan – SPPN (Preliminary) B&V - 24
CO2 Emissions Intensity – SPPN and SSPP (Preliminary) B&V - 25
Base Case Results Observations • SPP North requires capacity additions early: 2014 • SPP South requires capacity late: 2024 • As wind resources are added in SPPN between 2013-2020, new baseload resources not justified. Lower capital cost intermediate and peaking units are added in this period. • Baseload resources are added in SPPN after 2020 when energy needs increase but additional wind resources are not added in the model. • SPP South needs intermediate and new baseload resources for the base case in the later half of the study period. • As no carbon legislation is assumed in the base case, coal units are selected in the later half of the study. B&V - 27