Download
1 / 7
70 likes | 77 Views
Non-Gaussian probability of observed precipitation as a motivation of the SIR filter. Cosmin Barbu, Dr. I.V. Pescaru, Rodica Dumitrache.

E N D
Non-Gaussian probability of observed precipitation as a motivation of the SIR filter Cosmin Barbu, Dr. I.V. Pescaru, Rodica Dumitrache
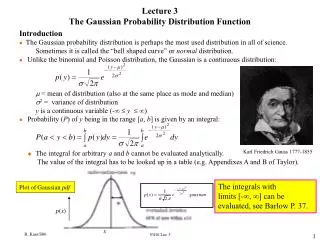
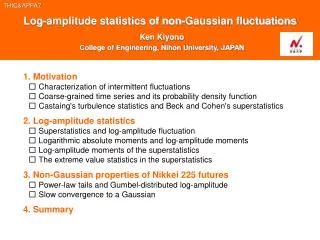
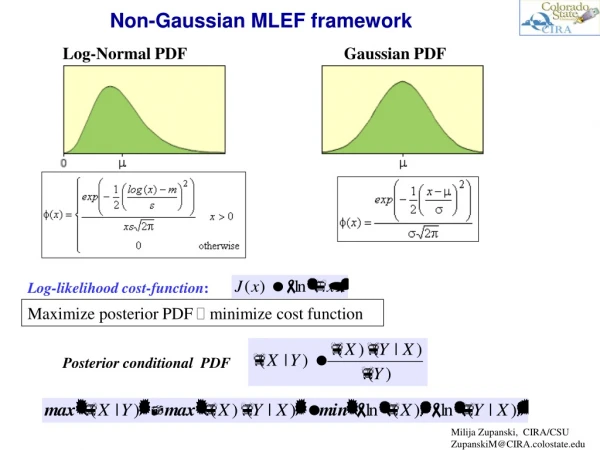
The aim of the project is to develop a prototype for a new data assimilation system for the convective scale by means of a sequential Bayesian weighting and importance re-sampling (SIR) filter The SIR filter is a Monte Carlo approach. It uses an ensemble of very short range forecast and selects the most likely members by comparing them to observations. From selected members a new ensemble is created for the next analyses time • The 1-st step is showing that the assumption of the Gaussian probability density function (pdf) isn’t justified for e.g. 3-hourly accumulated precipitation.
For finding out how the distribution vary in space and time it was chosen three German stations (Hamburg – coastal , Karlsruhe – Rhine valley, Kempten – near Alps). The idea is to determine how the results depend on the location of the station or the time of the year (spring, summer, autumn, winter) or the period of the day (morning, afternoon). There was analyzed precipitation data over a period of about 50 years for each weather station. The precipitation analyses were grouped by seasons, intervals during one day (accumulated over 3 hours for each season; over 6 hours within a certain interval in summer time; over 12 hours for each season.
The first time, an equidistant sampling was used with a bin size of various values: 0.5 mm/h, 1mm/h, 5mm/h The results that have been obtained are inconclusive Hamburg Karlsruhe Kempten
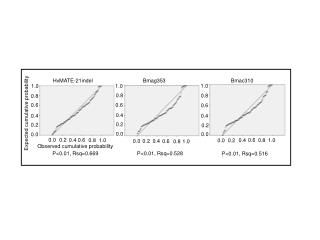
Hamburg Karlsruhe A new type of sampling was implement: • 0.1-1, 1-5, 5-10, 10-25, 25-50 mm/h: • 0.01-0.2, 0.21-1.0, 1.01-5.0, 5.01-25.0, >25.0 mm/h: Kempten • All period (3 h-accumulated) • Seasons (3h -accumulated) • 00-12h, 12-24h • 00-03h,03-06h, etc in spring, summer, • autumn, winter • 06-12h, 12-18h (only in summer time) • All period (3 h-accumulated) • Seasons (3h -accumulated) • 00-12h, 12-24h • 00-03h,03-06h, etc in spring, summer, • autumn, winter • 06-12h, 12-18h (only in summer time) Hamburg Karlsruhe • All period (3 h-accumulated) • Seasons (3h -accumulated) • 00-12h, 12-24h • 00-03h,03-06h, etc in spring, summer, • autumn, winter • 06-12h, 12-18h (only in summer time) Kempten
Conclusions : • For the 12 hours accumulated precipitation amounts log-normal distribution can be notice in the latter part of the day. • As a rule, it can be asserted followings the analysis of the graphs that the precipitation data do not display log-normal distribution.