Download

1 / 80
830 likes | 980 Views
Non-Observed Economy. Clementina Ivan-Ungureanu Training: Essential SNA: Building the basics Addis Ababa, 13-16 February 2012. NOE. The main objective of accounts is to offer an exhaustive description of an economy. Problem due to lack of coverage in NA:

E N D
Non-Observed Economy Clementina Ivan-Ungureanu Training: Essential SNA: Building the basics Addis Ababa, 13-16 February 2012
NOE • The main objective of accounts is to offer an exhaustive description of an economy. • Problem due to lack of coverage in NA: – For users: understanding the economy both in terms of levels and trends – For national accountants: imbalances in the internal consistency of accounts because some economic transactions are not measured
Why is this important? • Comparability of GDP across countries and time • Contributions and subsidies based on GDP • Growth rates if Unobserved growth ≠ Observed Growth • Economic/fiscal policy • GDP per capita, emissions, debt, deficit % of GDP
Content • Definition of NOE • Measurement methods • Special issues: illegal activities • Plan for strategy implementation
NOE Results: using simplistic assumptions, the users understand that the GDP figures published by NSO are underestimates. How to avoid? • Measurement program for improving the exhaustiveness of data, with clear objectives, roles and responsibilities for national accountants and for survey statisticians, • Proper quality management for NOE estimation
Terms used • NOE, black economy, grey, shadow, alternate, clandestine, hidden, invisible, parallel, secondary, unofficial, informal, underground economy • often not clear what is meant • negative connotation
Conceptual background • The 2008 System of National Accounts • Measuring the Non-Observed Economy, a Handbook (2002) – jointly prepared by OECD, IMF, ILO and CIS StatCom • Eurostat Pilot Projects on Exhaustiveness in 1998 and 2002 – Guidelines on Tabular Frameworks • NOE in national accounts- Survey of Country Practices, UN, 2008
What is NOE • Non-observed economy (NOE) refers to all productive activities that may not be captured in the basic data sources used for compiling national accounts. • The following activities are included: underground, informal (including those undertaken by households for their own final use), illegal, and other activities omitted due to deficiencies in the basic data collection program. The term ‘non-observed economy’ encompasses all of these activities and the related statistical estimation problems. Source: Non-Observed Economy in national accounts, Survey of Country l Practices, United Nations, 2008
NOE problem areas OECD Handbook outlines 5 problem areas: • Underground activities • Illegal activities • Household Production for Own Final Use • Non-Observed Informal activities • Deficiencies in Data Collection
1. Underground activities • All legal productive activities that are deliberately concealed from public authorities to avoid: • payment of income taxes or VAT • payment of social security contributions • meeting certain legal standards e.g. minimum wages • complying with administrative procedures e.g filling out statistical questionnaires or other forms
2. Illegal activities Those productive activities specifically covered by SNA production boundary that: – generate goods and services forbidden by law (e.g. production and distribution of illegal drugs) ; – are unlawful when carried out by unauthorized producers (e.g. unlicensed practice of medicine).
3.Production of households for own final use Productive activities that result in goods or services consumed or capitalized by the households that produced them, such as: – production of crops and livestock; – production of other goods for their own end use; – construction of own houses and other own-account fixed capital formation; – imputed rents of owner-occupiers, - services of paid domestic servants
4.Non-Observed informal activity Informal activities are: • conducted by unincorporated enterprises • in the household sector that are unregistered • and that have some market production. Characterised by: • a low level of organisation, • informal employment relations (e.g. oral agreements) • little or no division between labour and capital as factors of production, on a small scale
5. Deficiencies in data collection a. Under-coverage of enterprises in whole or in part - an enterprise is new and has not yet been included in the survey frameworks; – an enterprise falls below the size cut-off for surveys; – an enterprise has been incorrectly classified by type of activity or by region and thus improperly excluded from the survey frame; – an enterprise has not been entered in the statistical register, regardless of its desire to be, because of the lack of efficiency of the statistical system, or due to the fact that registers are not updated, for instance.
5. Deficiencies in data collection(cont) b. Non response by enterprises is depending on the sensitivity of the statistical system: enterprises are included in the sample but no data are collected from them and no imputation is made for the missing observations, because: – the survey questionnaire was wrongly addressed; – the enterprise, or part of it, did not return the questionnaire, they do not want to answer.
5. Deficiencies in data collection(cont) c.Under-reporting by enterprises : data is obtained from enterprises, but is misreported by the respondent, or correct data is received but is inappropriately input or weighted.
Eurostat N1-N7 framework • Introduced for the Pilot Projects on Exhaustiveness in 2002 • Starting point the characteristics of producers (registered or not, surveyed or not) • Four main categories: Non-registered; Not surveyed; Misreporting; Other
Eurostat N1-N7 framework(cont) • Defines standard set of non-exhaustiveness types (N1 to N7) and presents them in a tabular framework; • Provides a comprehensive and systematic assessment to ensure exhaustiveness of NA; • Facilitates cross-country comparisons of adjustments and adjustment methods and provides for similar level of coverage of NA.
I Not registered N1 - Producer deliberately not registering – underground: not register to avoid tax and social security obligations. Producers that do not register because they are engaged in illegal activities fall under type N2. N2 - Producers deliberately not registering – illegal : are involved in illegal activities. Type N2 excludes illegal activities by registered legal entities or entrepreneurs that report (or misreport) their activities under legal activity codes. N3 - Producers not required to register because it has no market output (non-market household producers that engage in production of goods for own consumption, for own fixed capital formation, and construction of and repairs to dwellings. Or, producer has some market output but it is below the level at which the producer is obliged to register as an entrepreneur
II Not surveyed N4 - Legal persons not surveyed due to several reasons such as: the business register is out of date or updating procedures are inadequate; the classification data (activity, size or geographic codes) are incorrect; the legal person is excluded from the survey frame because its size is below a certain threshold etc. N5 - Registered entrepreneurs not surveyed for a variety of reasons: the statistical office does not conduct a survey of registered entrepreneurs; the registered entrepreneur is not in the list of registered entrepreneurs available to the statistical office, or if available, is systematically excluded from it; the registered entrepreneur is not in the survey frame because the classification data (activity code, size code, geographic code) are incorrect.
III Misreporting N6 - Producers deliberately misreporting in order to evade income tax, VAT, other taxes, or social security contributions.
IV. Other N7 - Other statistical deficiencies • N7a: data that are incomplete, not collected or not directly collectable; • N7b: data that are incorrectly handled, processed or compiled by statisticians. Areas : non-response; production for own final use by market producers; tips; wages and salaries in kind; and secondary activities.
Standard tables The Tabular Approach involves the completion of three standard tables both for output and expenditure approaches: 1. Elements of non-exhaustiveness (detailed breakdown by type of unit, activity, non-exhaustiveness type and adjustment procedure); 2. Exhaustiveness adjustments (including the absolute and relative size of the adjustments listed above); 3. Summary of adjustments (by institutional sector and NACE activity or expenditure component).
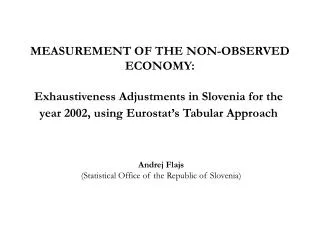
All economic activities of all enterprises Enterprises not in scope of enterprise survey or administrative source Enterprises in scope of enterprise survey or administrative source Enterprise not registered Enterprise registered Response or non-response correctly handled Non-response incorrectly handled N7b Enterprise not obliged to register N3 Enterprise should have registered Legal person Registered entrepreneur Enterprise under-reports N6 Enterprise reports correctly Underground activities N1 Illegal activities N2 Not in register N4a In register not surveyed N4b Not in register N5a In register ,not surveyed N5b All required data are collected Not all required data are collected N7a
Example • Country specific : phenomena, legislation, the magnitude of the NOE • Analysis of data sources and methods • Identification the types of NOE • Identification of all possible statistical and administrative sources • Defining the methods to estimate
Measurement methods The compilation methods for covering non-observed activities rely on indicators. Situations: • Coverage is often partial • Deficiencies in coverage and content • Overlap in coverage • Classifications used in various sources may differ • Concepts and accounting rules may differ • Indicators are often by-products. • Information is partial • Information is irregular or infrequent
Measurement methods(cont) 1. Statistical methods 2. Methods based on modeling techniques The choice of an appropriate method depends on the availability and quality of the data that can be used and the phenomenon in the country
1. Statistical methods 1.1 Direct methods based on direct surveys (survey on expenditures, income, labor, etc) 1.2 Indirect methods 1.2.1 Supply based methods 1.2.2 Labour input methods 1.2.3 Demand based methods 1.2.4 Income based methods 1.2.5 Commodity-flow method
1.1 Direct survey- opinion survey • Advantages: - The respondents are asking about their views rather than about their own behavior; - Senior managers and enterprises can be addressed directly • Disadvantage: no quantitative information that is readily useable
1.1 Direct survey- opinion survey(cont) Example: survey by Russian Federation Centre for Economic Analysis (2000) Type of question: • Please estimate (in ranges <5%, 6-15%, 16- 30%, 31-50%, 51-70%, >70%) the approximate shares of unregistered receipts by: large and medium retailers; small retailers; individual entrepreneurs;
1.2 Indirect methods 1.2.1 Supply based methods 1.2.2 Labour input methods 1.2.3 Demand based methods 1.2.4 Income based methods 1.2.5 Commodity-flow method
1.2.1 Supply based methods Is based on inputs that are used in producing goods and services. Input/output and input/value added ratios are used ( calculated previously based on specific survey or IOT frame). Examples; agriculture and construction output
1.2.2 Labor input method There are three basic steps: • obtain estimates of the supply of labour input to GDP, for selected economic activity and size of enterprise, from a household labour force survey and/or other demographic sources; • obtain estimates of output per unit of labour input and value added per unit of labour input for the same activity and size breakdown from regular or special purpose enterprise survey; • multiply the labour input estimates by the per unit ratios to get output and value added for the activity and size categories
1.2.2 Labor input method(cont) Steps: • Collection of enterprise data- surveys and administrative data ( use) • Collection of household data – LFS, population census ( supply) • Comparison supply-use of labor inputs • Identification of labor missing from use side • Compilation of O and GVA
1.2.3 Demand based methods Production is estimated by using indicator data on specific uses of goods and services. They could be -household final consumption expenditures of a certain commodity (e.g. health and personal services), • uses of major products as raw materials (e.g. processing of agricultural products), • exports (e.g. major export commodities), • administrative data indicating demand for a product (e.g. motor vehicle registrations and building permits). After a measure of output has been obtained,VA estimates can be derived using O/VA ratios, as for supply-based methods.
1.2.4 Income based methods Some categories of income are available from administrative sources and can be used to obtain an indication of production covered by the administrative system. They could be: • Income tax paid by self employers • Social security taxes • Turnover from VAT records
1.2.4 Example Calculation of O, IC and GVA for units in private education activity. • For these units there are available data from: • financial statements ( complete balance sheets) • Mini balance sheets( for small units) • VAT declarations • Data from social security ( wages and number of employees)
1.2.4 Example- Estimation of indicators for units with data (cont)