Download
1 / 16
160 likes | 381 Views
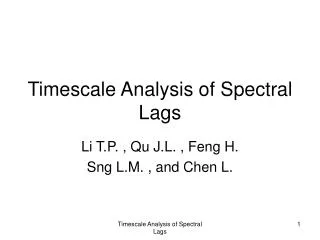
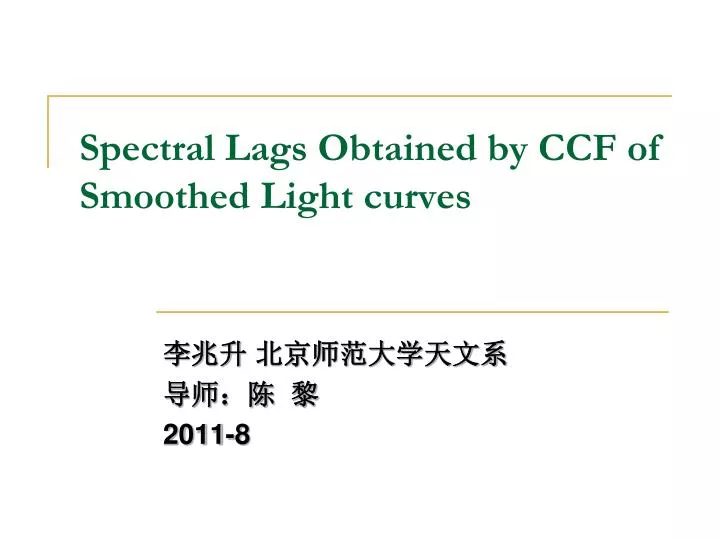
Spectral Lags Obtained by CCF of Smoothed Light curves. 李兆升 北京师范大学天文系 导师:陈 黎 2011-8. Outline. Introduction Smooth light curves M-C simulation Sample selection Error estimation Results. 1 Introduction. 能谱延迟:高低能段光子到达的时间差 计算方法: 交叉相关( cross correlation function ) 时间序列.

E N D
Spectral Lags Obtained by CCF of Smoothed Light curves 李兆升 北京师范大学天文系 导师:陈 黎 2011-8
Outline • Introduction • Smooth light curves • M-C simulation • Sample selection • Error estimation • Results
1 Introduction • 能谱延迟:高低能段光子到达的时间差 • 计算方法: 交叉相关(cross correlation function) • 时间序列
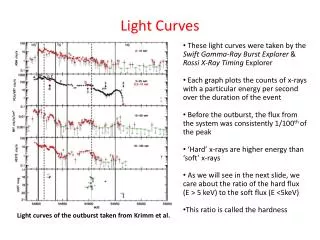
CCF有随机波动,通常用高斯函数或多项式拟合最大值CCF有随机波动,通常用高斯函数或多项式拟合最大值 GRB 050922C 15-25keV vs. 50-100keV 拟合CCF的问题 1.高斯(CCF形态复杂,非对称峰) 2.多项式(次数)
2. Smooth light curves • 平滑参数 ,T90的 100% 为平滑宽度(平滑窗) • 二次多项式拟合(loess) • 平滑后做交叉相关(CCF),其最大值对应的时间作为lag GRB081222 越大,平滑 程度越强
3. M-C simulation • 确定平滑参数 • M-C 模拟 • 叠加噪声,SNR~3-10 SNR=5
Lag与的依赖关系较弱,在= 0.1 处,拟合的结果很集中,与给定的lag相比,相对误差在5%以内所以,选择 0.1 Lag=0.144s
Smooth vs. Gauss GRB 080413B,两者几乎重合
GRB 071020, A点为Gauss拟合的最大值处,依赖拟合区间的选择,B点是平滑方法的最大值处,拟合区间变化,B点的位置稳定
4. Sample selection • BAT/Swift • 15-25 keV vs. 50-100 keV • Enhanced XRT position • C_max/std(bck)>6
5. Error estimation • 假设高低能段的计数率和对应的误差分别为 构造 分别满足 重复1000次,标准差为误差
6. Results 平滑和高斯拟合的结果对比 平滑lag要小于高斯拟合lag
Lag-duration relation • Jon Hakkila et al.(2008) 认为GRB脉冲宽度和lag有较强的正相关性(R=0.95)。 R=0.58
Lag distribution 用3成分高斯函数拟合,中心分别为0.003s, 0.05924s, 0.1785s
结论 • 方法简单,减少人为因素 • 模拟结果对于S/N>6的GRBs,取=0.1合理 • 实算结果与原来方法比对,有较强的线性关系,但lag稍小,这不是平滑造成的; • Lag的分布用3个成分~3ms, ~60ms, ~180ms拟合得较好,但其物理机制尚不清楚 谢谢!