Download

1 / 16
170 likes | 407 Views
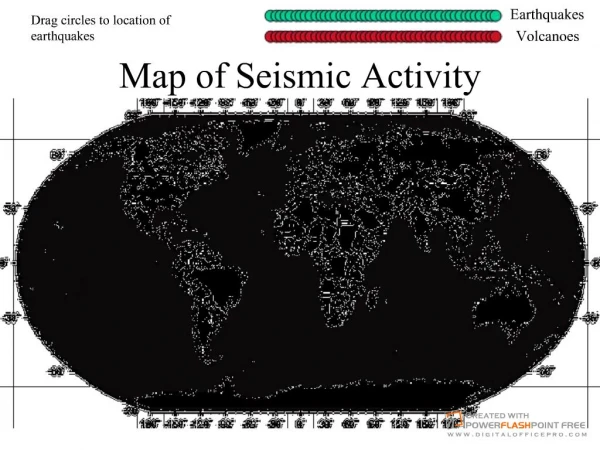
Smoothed Seismicity Rates. Karen Felzer USGS. Smoothed seismicity. Smoothed seismicity is used in many forecasts, including the National Hazard Maps and UCERF2, to help constrain the off-fault hazard.

E N D
Smoothed Seismicity Rates Karen Felzer USGS
Smoothed seismicity • Smoothed seismicity is used in many forecasts, including the National Hazard Maps and UCERF2, to help constrain the off-fault hazard. • It has been statistically demonstrated that smoothed seismicity is predictive of future earthquakes (Kagan and Jackson, 2000; Kafka 2007). It works for small earthquakes and for M>6 (Kafka, 2007). An upper magnitude limit for applicability has not been demonstrated.
Potential smoothing methods for UCERF 3 • National Hazard Map smoothing method (Frankel, 1996) • Helmstetter et al. (2007) smoothing method (Currently winning RELM Southern California 5 year earthquake forecasting test) • Modified Helmstetter et al. (this talk)
National Hazard Map smoothing method linear scale The catalog is declustered using Gardner and Knopoff (1975) The Weichert method is used to calculate rates in each bin from M≥4, M≥5, and M≥6 earthquakes from different periods. Rates are smoothed around each bin using a Gaussian kernel and a fixed 50 km smoothing constant. Map created from 1850-2010 catalog data
Helmstetter et al. (2007) smoothing method log10 scale • The catalog is declustered using Reasenberg (1985). Remaining catalog still has some clustering. • M≥2 earthquakes are used from >1981 only. • A Gaussian or power law kernel with an adaptive smoothing constant is expanded around each hypocenter. Map uses 1981-2005 catalog data
Modified Helmstetter et al. (2007) smoothing method log10 scale • No declustering.* • Uses M≥4 seismicity back to 1850, all magnitudes treated equally.* • Uses power law kernels centered at each hypocenter, with the Helmstetteradaptive smoothing constant. • Calculates smoothed values at bin centers rather than integrating across bins.* • Only relative rates have been calculated for the current implementation. 1850-2010 catalog data *Improves result *Makes life simpler
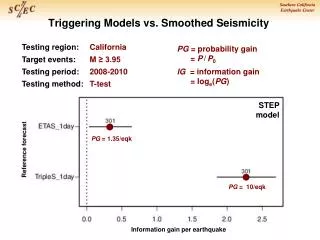
The different methods can be evaluated using the MLE Gaingiven in Helmstetter et al. (2007) G = Gain L = log likelihood of forecasting map Lunif = log likelihood of a uniform probability map N = Number of earthquakes Evaluation is performed only within the UCERF polygon
Retrospective tests performed • NHM vs. modified Helmstetter for forecast of M≥6 earthquakes over 1957-2006 (50 yrs): 30% higher gain for Helmstetter. • Modified Helmstetter with no declustering vs. modified Helmstetter with Gardner and Knopoff (1975) declustering: Non-declustered tend to have a higher gain, but statistical difference not established. Reasenberg (1985) declustering may improve results.
Retrospective tests needed • NHM vs. Helmstetterover multiple 1 and 5 year periods. • Modified Helmstetter vs. full Helmstetterover 1 year, 5 year, and 50 year periods. • More tests with declustering (discussion coming up next!).
Arguments against declustering • All declustering methods are to some degree arbitrary and incomplete. • Earthquakes continue in aftershock zones for years. We would not want to miss the next Hector Mine or Christchurch. • Current declustering methods bias magnitude-frequency statistics by a-posteriori removing the smaller earthquakes in a cluster. This is not helpful for a-priori forecasting.
Failing to predict aftershocks is not helpful Darfield, M 7.1 Sorry, but according to our b value you didn’t have an earthquake! Christchurch, M 6.3
Arguments for declustering • Some declustered forecasts appear to perform better. Why? Some thoughts: • Declustering emphasizes larger earthquakes. More aftershocks occur around larger earthquakes => higher future risk in these areas. • Declustering effectively decreases the hazard from aftershock zones that may have been much more active in the past than at present. However, the risk from still-active aftershock zones might be decreased too much by rigorous declustering.
A proposed modified approach • Use ETAS, rather than straight smoothing, to model very large/recent earthquakes that are still producing aftershocks at a rapid rate. This will give the larger earthquakes the extra risk, at a presumably more correct rate. • Decrease the risk associated with earthquakes in long-dormant aftershock zones, using empirical measures or ETAS to estimate amount of decrease. • Do not alter the magnitude-frequency distribution • Test, Test, Test!!!
Decisions that need to be made • Smoothing method: NHM, Helmstetter,modified Helmstetter ? • Declustering: Gardner and Knopoff, Reasenberg, no declustering, or the modified approach? • Magnitude-frequency distribution: Declustered distribution, or full catalog magnitude-frequency distribution?
Decisions that need to be made • What tests will be definitive for choosing one method over another? What confidence level do we want of improvement before selecting a new method? • Is there a measure of performance that we want besides the Helmstetter MLE Gain?