Download
1 / 35
350 likes | 453 Views
Basics of HCI reporting in DRG system. – RIC AND LINDY. Implementing a DRG funding system. Activity data – coding accuracy and completeness – don ’ t wait for perfection. Costing data – from a sample group of hospitals – can import initially.

E N D
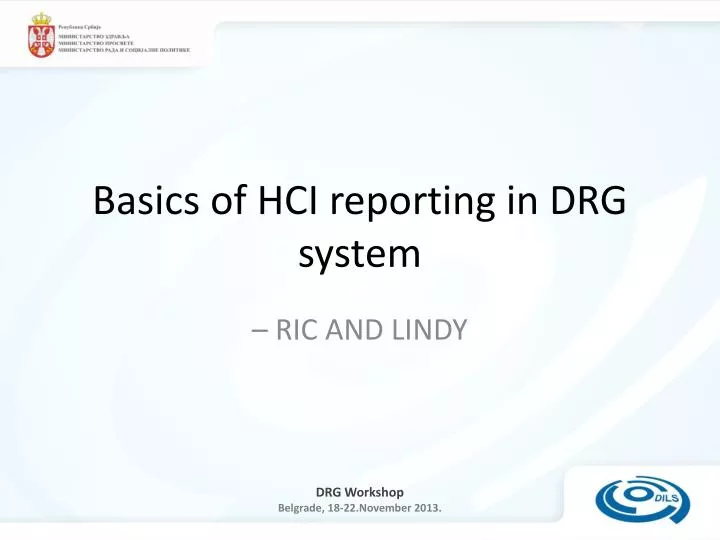
Basics of HCI reporting in DRG system – RIC AND LINDY
Implementing a DRG funding system • Activity data – coding accuracy and completeness – don’t wait for perfection. • Costing data – from a sample group of hospitals – can import initially. • Modeled budgets and phased implementation plan with adjustment period.
The reasons why hospitals want to measure what they do? • Manage to a budget. • Perform to peer benchmark with best value services. • Technical efficiency • Allocative efficiency • Quality • Give the best service possible to their community.
Measuring efficiency and quality of health services • Cost per weighted unit of output • Performance indicators on outcomes • Negative – hospital acquired complications • Positive – eg milestone indicators – health status outcomes – satisfaction … • Process compliance with best practice protocols
What Do You Do Without Casemix? • BEDDAYS … • Discharges … • Shroud waving • Global budgets and top-ups • SERVICE AVAILABILITY • Quality?? • Value????
Beds LOS and DRGs http://www.aihw.gov.au/publications/health/ihhac/ihhac-c06c.pdf
“But our hospital gets all the difficult cases” • Measuring efficiency and effectiveness • ‘Doing the thing right’ • ‘Doing the right thing’ • How many hospitals do you need - where? • How many MRI scanners do you need - where?
OTHER INDICATORS http://209.85.135.104/search?q=cache:Uscfbb-xVvgJ:www.stat.go.jp/english/data/figures/zuhyou/1696.xls+beds+per+1000+international&hl=en&ct=clnk&cd=5&gl=au ARE THESE MEASURES REALLY LIKE WITH LIKE??????????
Where should the budget (growth) money go? • To the regions that have the most people? • To the towns that have the most hospitals? • To the hospitals that do the most work?
TYPICAL PROBLEMS • Perverse incentives/inefficient resource allocation • Lack of transparency • Poor clinical data (diagnoses and procedures) • Poor measures of expected cost per case type • Mistrust between funders and care providers • Unclear vision about mid-term goals
Need to agree on fair measurements • HOWEVER - it's hard to agree, because data are never good enough • It's hard to compare locally or internationally • ‘MY CASES ARE HARDER THAN YOURS!’ • We are arguing about things that could and should be measured
The casemix development program • A ten year program from 1989 • Included DRG redesign program • Data standards and reporting • National health information agreement • Linkages to • Budgets • Funding • Payment • “1 2 3 – DRG” ?????
IMPLEMENTATION SUPPORT POLICY OFFICIALS GOVERNMENT MINISTERS ACADEMICS INDUSTRY EXECUTIVES EXPERTS
From .. Medicare .. to ..Australian Healthcare Agreements • Common data standards – casemix and data quality • “ONE SIZE FITS ALL” DRGs? – The case for localisation • Minimum datasets – where did my data item go? • Performance feedback in useful timeframes? Examples later
EARLY IMPLEMENTATION THROUGHPUT MORE CASES WITHOUT EXTRA BUDGET – LOWER LOS
# of Beds: 500 # of Inpatients: 26,000 Avg. Length of Stay: 6,0 d. BedTurnover rate: 52 pat. # of Beds: 380 # of Inpatients: 42,800 Avg. Length of Stay:3,23 d. BedTurnover rate: 113 pat. % 24 % 64 % 46 % 117 DRGs Applications Impact
Clinical Quality Indicators • Perforation of the colon following a colonoscopy procedure • Anastomotic breakdown • following large bowel resection and anastomosis for cancer of the • - colon - rectum • Bile duct injury following cholecystectomy requiring operative intervention • Mortality following repair of abdominal aortic aneurysm
Australian Implementation Experience • The importance of • Risk management – modelled effects • Transparency of the rules • Learning from mistakes • Australia still refining models • New challenges – solve some, others appear • Some basic building blocks
http://www.health.gov.au/internet/wcms/publishing.nsf/Content/15033D7F2949990CCA256F1D00294D9F/$File/tbl8b_17.pdfhttp://www.health.gov.au/internet/wcms/publishing.nsf/Content/15033D7F2949990CCA256F1D00294D9F/$File/tbl8b_17.pdf
National Admitted Patient Care Collection (NAPCC) http://health.gov.au/internet/wcms/publishing.nsf/Content/health-casemix-data-collections-statistics
National Hospital Cost Data Collection (NHCDC) http://health.gov.au/internet/wcms/publishing.nsf/Content/health-casemix-data-collections-statistics PUBLIC PRIVATE
Benchmarking by cost only … Mean cost/case Nursing Medical Allied health OR Pathology Imaging Pharmacy Consumables Overhead Other Total Our hospital 750 500 170 420 90 65 120 75 450 200 $2850 Other hospitals 550 420 180 340 80 50 110 90 380 200 $2400
Look! You spent too much on patient 15644 But patient 15644 was different from normal
I've checked, and patient 15644 wasn't different at all! Sorry, I'll try not to do it again
… and benchmarking by clinicians Other hospitals 6 hours Nil Yes Yes Elements of cPaths Admitted how long before procedure? Post-op hours in CCU Review of discharge plan at admission? Discharge OK delegated? Our hospital 9 hours 6 hours No No
Giving feedback to hospitals on the efficiency and quality of their outputs
Feedback mechanisms • Payment signals – price vs cost • Bonuses for output target achievements • Bonuses for performance indicator attainment:- • Waiting lists – ED – Elective surgery – • Capacity improvement • Coding statistics • Expenditure levels reporting
1. Activity data 2. Expenditure data 3. Modeled budgets The 3 key components of a DRG funding system
1. Hospital (IP) activity by DRG • tabulated to produce a table of hospital by DRG. • activity data checked for completeness and accurate DRG assignment.
2. Budget/expenditure data • hospital budget data – one years estimate and/or actual expenditure by hosptial • inpatient fractions (IFRACS) • throughput payment proportion or components (eg if salaries not included need to be taken out of • costweights and • payment model).
3. Modeled budgets • Complete allocation of funding • Service level agreements • Targets for specific services • By period • By service type • Caps on discretionary services • Conditions of funding/payment - consequences
THE THREE MUSTS OF CSMX • Start from where you are • Decide where you want to go • Take achievable steps