Download
1 / 53
530 likes | 709 Views
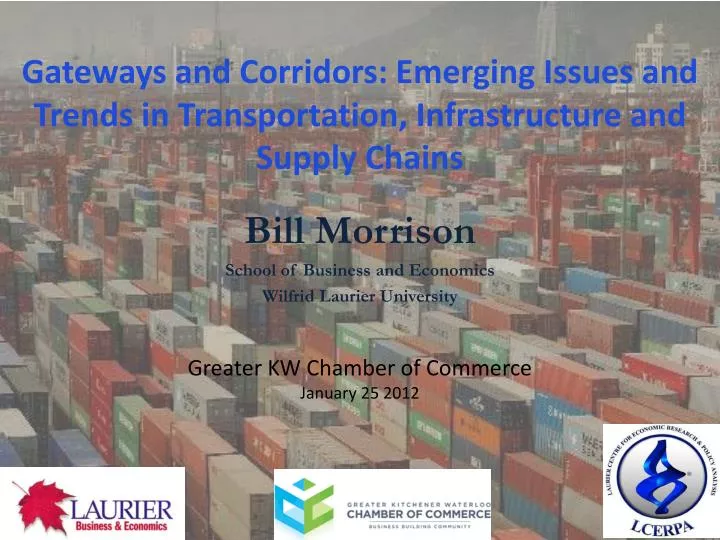
Gateways and Corridors: Emerging Issues and Trends in Transportation, Infrastructure and Supply Chains. Bill Morrison School of Business and Economics Wilfrid Laurier University. Greater KW Chamber of Commerce January 25 2012. Robert Burns: 1759-1796.

E N D
Gateways and Corridors: Emerging Issues and Trends in Transportation, Infrastructure and Supply Chains Bill Morrison School of Business and Economics Wilfrid Laurier University Greater KW Chamber of Commerce January 25 2012
Robert Burns: 1759-1796 O wad some Power the giftiegie usTo see oursels as ithers see us!It wad fraemonie a blunder free us An foolish notion:What airs in dress an gait wad lea'es us, An ev'n devotion! - To a Louse (1786) . . . self-deceit, this fatal weakness of mankind, is the source of half the disorders of human life. If we saw ourselves in the light in which others see us, or in which they would see us if they knew all, a reformation would generally be unavoidable. We could not otherwise endure the sight. - Adam Smith (1723 – 1790)
Who makes the iPod? Toshiba Hard Drive = $73.39, But Toshiba manufactures these drives in the Philippines and China...parts and labour cost about $54 The final assembly happens in China But the real story is in the components… Source: Who Captures Value in a Global Innovation System? The case of Apple's iPod, Linden et al, Communications of the ACM, March 2009.
The global iPod supply chain... • Apple and the US benefit from • Apple’s global supply chain • Innovation matters: those who • produce value-added components • reap the benefits. • The coordination and transportation inherent in the supply chain are crucial to the value generated by the iPod • “Those clever folks at Apple figured out how to combine 451 mostly generic parts into a valuable product. They may not make the iPod, but they created it. In the end, that’s what really matters” • - H. Varian, Chief Economist, Google • NY Times, June 2007.
Containerization as an enabler of global supply chains Past and forecast global container volumes Source: UNESCAP, 2006. • From 1987-2006, total international maritime trade volumes grew at an average of 4.1% • By 2006 total seaborne trade was at almost double 1990 volumes. • Containerized cargoes have grown at an annual • average rate of 9.5 per cent over the same period, resulting in a five-fold increase in container • movements.
Container Throughput in China:1975-2006 Source: Y Zan (2007): Development of Gateways and Corridors in China
After the financial crisis and global slowdown… Source: China in 2015, Credit Suisse, January 2011
Projected US Rail Traffic Flows Source: Stalk (2010)
Truck Traffic in the US - 1998 Source: Stalk (2010)
Congestion crisis ahead? “The Coming Infrastructure Crisis: Is Your Supply Chain Ready?”, Boston Consulting Group, Feb. 2011
Asia-Pacific Gateway and Corridor Initiative North America's closest major ports to Asia Atlantic Gateway Ontario-Quebec Continental Gateway and Trade Corridor Canada’s Gateways Opportunity and Policy Response North America's closest ports to Europe, Latin America and ships transiting the Suez Canal Canada’s Gateways leverage our major inter-modal transportation and trade systems, and Canada’s geographic advantages to connect North America with the world – and Canadians with new opportunities in the global economy. Source: Transport Canada
Potential advantage to Canada? • In the US there is not currently an analogue to Canada’s gateway-corridor (system-wide) concept. • Each port relatively independent • No policy focus on integrating road, rail and gateways • However there is some concern that we have not leveraged the gateway-corridor system approach to our advantage yet.
In Canada the big focus has been on the Asia-Pacific Gateway and Corridor Initiative • Issues: • Capacity • Congestion • Environment • Energy – gateways as exits • Intermodal transportation, logistics costs and global supply chains • Government investment of $1 billion in the port of Vancouver • Public Private Partnerships – $2.8 billion
Prince Rupert • By 2020, the Port of Prince Rupert’s goal is to provide a total of four million TEUs of container handling capacity: • The C$170 million Phase 1 of the Fairview Container Terminal was completed in September 2007, providing 500,000 TEUs of container handling capacity. • The planned C$650 million Phase 2 of the Fairview Container Terminal will add 1.5 million TEUs of container handling capacity by 2014. • A second container terminal is planned to increase the port’s container handling capacity by another two million TEUs by 2020.
Standard Transit Times From Shanghai • Shanghai to: • Vancouver Toronto = 21 days • Vancouver Chicago = 18 days • Prince Rupert Chicago = 16 days • New York Chicago = 28 days Source: J.P. Rodrigue, 2010
Cost Implications of ship capacity after Panama Canal Expansion Total cost per TEU = $1425 Total cost per TEU = $2000
Share of NE Asia-US East Coast Route by Option Source: J.P. Rodrigue, 2010
Many elements to the problem of optimizing global supply chains • Transit times • Direct cost • Reliability (variability of transit times) • Environmental impact • Potential for improvements (elimination of bottlenecks, integrated logistic centres etc.)
Greener supply chains:David Suzuki speaks at a Wal-Mart conference?
Why is Greening the Supply Chain good business for Wal-mart? • “Wal-Mart, the nation’s largest retailer, announced on Thursday that it would cut some 20 million metric tons of greenhouse gas emissions from its supply chain by the end of 2015 — the equivalent of removing more than 3.8 million cars from the road for a year” • New York Times, Feb 25 2010.
Has Wal-Mart altered its business model to become more ‘green’? • Wal-Mart view: • Yes. Significant positive environmental impacts from Wal-Mart initiatives. Institutional and cultural changes within the Wal-Mart operation. • These changes have also had a positive effect on profitability, but what’s wrong with mutual benefits to Wal-Mart and the environment? • Sceptic’s view: • No. Wal-Mart exists to maximize profits. All its green efforts are actually just efforts to force suppliers and others to reduce costs (to Wal-Mart’s benefit). The only shift has been to ensure wherever possible to connect cost cutting to positive environmental impacts.
What drives Wal-Mart (private business)? • How do you grow profitability in a soft economy? • Cut costs • Be price competitive against rivals • ‘Sustainability is about getting rid of waste, so business and the environment go hand in hand’ - Olivier Joubert (Director of Logistics, Wal-Mart Canada)
Air > 1,500 km(Boeing 747-400) 5,582 Truck(Global Average) 472 205 Rail diesel Rail electric(Global average) 176 Ocean(Avg. ML-owned vessels) 84 0 1,000 2,000 3,000 4,000 5,000 6,000 grams of CO2 emitted per (TEU.km) CO2 Emissions by Mode of Transportation Source: Cardin, 2010. • Ocean shipping has the lowest environmental impact for long distance transportation.
Vessels are becoming more energy efficient, so are reducing emissions • Due to • Technologies • Operations • Speeds • Vessel size About 20% lower than 2002 levels Maersk reduction target for 2020 is 25% below 2007 levels Source: Cardin, 2010.
Typical 2007 schedule: 12 vessels Fuel consumption: 12,000 MT Redesigning routes to reduce speed has great impact 31,000 MT CO2 19 Knots 37,000 MT CO2 20.5 Knots • 12 × • 13 × Long Beach (CA) Long Beach (CA) Barcelona Hong Kong Barcelona Hong Kong Source: Cardin, 2010. • 16% Savings on fuel reduces costs and emissions of CO2 and criteria pollutants
”Super Slow Steaming” Initiative • Study started in 2007, covered 110 different vessels • Maersk collaborated with engine manufacturers • Results of tests: • Manufacturers have changed recommendations • OK down to 10% engine load (half speed) • Previous recommendation was 40 – 60% • Operational results: • More flexible voyage & schedule planning • Increased schedule reliability • 10 – 30% fuel savings and reduced CO2 • Significant cost savings Source: Cardin, 2010.
Environmental and cost pressures suggest some interesting scenarios • Suppose • Environmental pressures need to lower GHGs • Reliability/cost dominate fast transit times in supply chains • Panama expansion creates a feasible alternative to intermodal shipments (to West coast) • Technological improvements in cargo vessel design/operations facilitate ‘green’ cost savings • Strategic shift away from intermodal and less opportunity for west coast gateways (Van., Pr. Rupert) perhaps more opportunity for Halifax?
The Ontario-Quebec Continental Corridor • Key point of entry for international trade with the United States' economic heartland and large consumer markets • Includes many ports along the St. Lawrence River and the Great Lakes, as well as Toronto/Montreal airports.
Continental gateway issues • Initiatives underway: • Review of international research on dedicated truck lanes (TC-ON-QC) • Harmonizing regulatory requirements for commercial vehicles between Ontario and Quebec (ON-QC) • Transportation system analysis to identify current and future bottlenecks (TC-ON-QC) • Ontario-Quebec Trade and Cooperation Agreement (ON-QC) • Workshops on competitiveness issues (Air Cargo, Marine, Technology and others) (TC-ON-QC)
Border delays and security • Parts and sub-assemblies of cars pass back and forth across the CAN-US border many times. Delays add real costs to production. • Nguyen and Wigle (2011) total costs of border delays Using a regional computable general equilibrium model Covers 23 commodities, 12 sectors, and three labour skill levels for five regions (QC, ON, BC, Atlantic Canada and the Prairie Provinces). Estimating all effects of border delays including labour market flows between sectors and wages • The total economic cost of border delays estimated to be somewhere in the range of $15-30 billion annually.
Continental gateway issues • Mutual Recognition Arrangements (MRAs) Under MRAs, firms are only required to clear security on one side of the border (and do not have to replicate the procedure on the other side). Time and cost savings
Windsor-Detroit Border Crossing: when infrastructure crosses borders… • Largest Canada-US highway crossing, 25% of Canadian exports • Nearly all over privately owned Ambassador Bridge • Incomplete connection between Highway 401 and bridge – 11 signalized intersections Source: Anderson, 2010
The Detroit River International Crossing Project Source: Anderson, 2010 • Partnership of four governments • US Federal (FHWA) • Canada (Transport Canada) • Ontario (MTO) • Michigan (MDOT) • Began Planning Needs and Assessment process in 2002 (report 2004) • Identified need for new road crossing • Assessed a variety of alternatives
DRIC = Two Projects Source: Anderson, 2010 • Windsor-Essex Parkway • Highway from 401 to new bridge • Cost estimate $1.6 billion • “DRIC Bridge” • Bridge from Brighton Beach to Delray • Inspection Plazas • I-75 interchange
Windsor-Essex Parkway Source: Anderson, 2010 EA approved (Ontario and Canada) August 2009 To be developed as Alternative Financing and Procurement (AFP) project by Infrastructure Ontario Land acquisition and preliminary construction under way RFP issued December 2009, bids due July 2010 Agreement with City of Windsor May 2010
US Project Support Source: Anderson, 2010 Michigan Legislature has blocked funding except for studies No legal framework for PPP Federal funding from GSA, no FHWA commitment Promised “loan” of $550 M from Canada (to be recovered from toll revenues)
Not ready for PPP? Source: Anderson, 2010 • Senate majority leader Mike Bishop concerned that PPP model does not give Michigan legislature sufficient oversight • Representative Chuck Moss (quoted in Crain’s June 4, 2010): • “It’s a very flawed bill. It creates a private-public partnership that basically is an authority that once it gets set up can run on its own.” • “I’m very nervous when you have unelected officials making those decisions. And it’s bad enough to cede control to unelected American people, but to Canadians as well?”
Recent events in Michigan Source: Anderson, 2010 • Legislation to create PPP framework and release project funds • Passed House by narrow margin May 26 (no republican votes) • In November 2011, a Republican-dominated senate committee voted down the proposal. • Not clear what if anything will happen now.
Concluding comments • Canada’s future prosperity linked to reducing the frictions created by global supply chains • Development of logistics capabilities (technology and management) • Development of our transportation networks (gateways and corridors) • Potential importance of a national strategy • Links to productivity • Role of natural resource exports • Moving towards value-added economic activity
Further Reading “Four Figures and a Table: Canada’s Gateways and Corridors in a Global Context • Available at: www.lcerpa.org/policy-briefs • Longer version available at www.gateway-corridor.com
Thank you for your attention W. Morrison
Gateways and Corridors as Exits • Most of the attention to date has been focused on the flow of ocean cargo into Canada from Asiahowever gateways and corridors are also potential exits. • Increasing focus on expanding Canada’s outbound capabilities to serve Asian markets • Attempts to increase exports to China • Exporting of energy products and natural resources • Diversifying away from the USA
Gateways and Corridors as Exits • Energy Trade with Asia-Pacific • Energy exports to Asia-Pacific from Western Canada grew 424% between 2004-2009, representing 18.3% of total Western Canada exports to that region. • Currently Japan dominates Asian-Pacific demand for Canadian energy exports Predominantly coal from BC But Korean and Chinese demand growing fast • China predicted to account for 25% of world energy consumption by 2035 and over half the world’s coal consumption
Gateways and Corridors as Exits • Foreign direct investment by Asia-Pacific countries in Canada’s energy sector on the rise 2009: Japan = $13.1b China = $8.8b