Download
1 / 42
420 likes | 633 Views
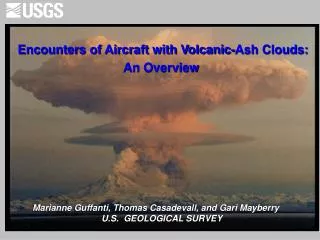
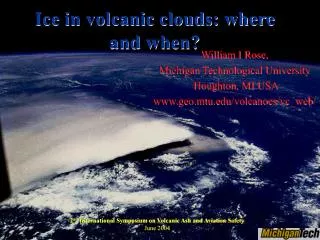
Ice in volcanic clouds: where and when?. William I Rose, Michigan Technological University Houghton, MI USA www.geo.mtu.edu/volcanoes/vc_web/. 2 nd International Symposium on Volcanic Ash and Aviation Safety June 2004. What are volcanic clouds?. Clouds and precipitation analogy

E N D
Ice in volcanic clouds: where and when? William I Rose, Michigan Technological University Houghton, MI USA www.geo.mtu.edu/volcanoes/vc_web/ 2nd International Symposium on Volcanic Ash and Aviation Safety June 2004
What are volcanic clouds? • Clouds and precipitation analogy • After initial fallout of large (>1mm) particles, a volcanic cloud remains and it drifts about for days to months. • The volcanic cloud contains: Fine particles of ash, sulfate aerosol and hydrometeors Gaseous components, some volcanic and some the result of reactions with atmosphere
Examples of Ice in Volcanic Clouds • Ice Clearly Dominant: Rabaul 1994; Hekla 2000 • Ice Clearly Subordinate: Spurr 1992; Augustine 1986; Cleveland, 2001; Kluchevskoi, 1994 • Subequal ash and ice: Montserrat (Boxing Day, 1997) Pinatubo (15 June 1991) El Chichón (4 April 1982) ~250 KT fine ash No ice detected
Each of the pixels in the volcanic cloud can be replotted on a retrieval diagram, where its measured values can be compared with calculated values for spheres of various sizes with refractive indices equivalent to andesite. This give a rationale for mass determination of ash. Wen & Rose, 1994, JGR 99: 5421-5431
Rabaul, 19 Sept 1994 ~2 MT ice, no fine ash detected ~80 KT SO2 Rose et al, 1995, Nature 375: 477-479.
Ice mass in cloud is >2MT SO2 sequestered Salty rainfalls in a wide arc N and NW Sea salt in the tephra Ice may reduce residence time of ash and SO2 Rose et al, 1995, Nature 375: 477-479.
Source of H2O? Sea water entered the active vent at Vulcan. Vulcan Shuttle radar image, NASA
Hekla, 26 February 2000 • Magma erupted: 0.11 km3 = 3 x 10⁵ Tg, mostly long after explosive phase • Ice in stratospheric cloud > 1 Tg • SO2 in stratospheric cloud ~100 kT (TOMS) 160-240 kT (MODIS) • Sulfate in stratospheric cloud 3-5 kT • Fine ash mass ~100 kT --only detected in first hour • Ice prominence due to large magmatic contribution? Rose et al, 2003, AGU Geophys Monograph 139: 107-132.
Total mass of fine particles in the Hekla volcanic cloud peaks at ~ 1 MT and decreases after 10 hours. Rose et al, 2003, AGU Geophys Monograph 139: 107-132.
Cleveland, 19 February 2001 • Fine ash mass ~ 30 kT • SO2 release ~10 kT • Slight separation suggesting that SO2 was early and higher • Ice signal absent • SO4 mass ~2 kT • SO2 and ash interferences of interest
Cleveland Volcano, Aleutian Is GOES-W 4-5 Brightness Temp Difference Image D J Schneider USGS/AVO
D J Schneider USGS/AVO
D J Schneider USGS/AVO
D J Schneider USGS/AVO
D J Schneider USGS/AVO
D J Schneider USGS/AVO
D J Schneider USGS/AVO
D J Schneider USGS/AVO
Spurr, 19 Aug 1992 ~400 kT fine ash ~300 kT SO2 No ice detected Transparent fringes and opaque core > 2 Rose et al, 2001, J Geol 109: 677-694
ATHAM Eruption ConditionsAxisymmetric mode • Topography: Volcano width: 7.5 km. Elev 2.3 km, crater .7 km diam and .1 km depth • Temperature: Ambient 273K; magma 1273 K • Magmatic gasfraction: 3 wt % • Vent radius: 75 m; exit velocity: 250 m/s • Tracing ash: Coarse (90 microns); Fine (25 microns) ash modes with proportion 1:1 • Atmospheric profile: Radiosonde data from Anchorage • Eruption rate: use average from observations, 1100 m3/s C M Riley,2002, Ph D dissert, Michigan Tech Univ C Textor et al, 2004, JGR in press
ATHAM one hour old Spurr plume-- approximates observed height, width ash C M Riley,2002, Ph D dissert, Michigan Tech Univ C Textor et al, 2004, JGR in press
ATHAM one hour simulation-- Ice masses are <1% of ash ice C M Riley,2002, Ph D dissert, Michigan Tech Univ C Textor et al, 2004, JGR in press
Soufriére Hills 27 Dec 1997 • Slope failure and dome collapse • Pyroclastic surge and flow went into the sea, which caused a meteorological cloud • GOES 10 µm IR data shows the volcanic cloud growth well Mayberry et al, 2003, Geol Soc London Mem 21: 539-555.
Soufriére Hills 27 Dec 1997 • 2 Volcanic clouds about 12-15 km high resulted--one was ash rich (red-brown at left) and the other mainly ice (blue) • 15 km high, the two clouds overlap with distinguishable regions • Ash mass was ~45 kT; ice ~150 kT Mayberry et al, 2003, Geol Soc London Mem 21: 539-555.
Pinatubo 15 June 1991 • ~80 MT ice • ~50 MT fine ash • 18-19 MT SO2 • ~3MT sulfate • Fallout of fine ash and ice was >90% in 3 days • SO2 was sequestered by ice • Subequal masses of ice and fine ash make detection quite difficult Guo et al, 2004, G3, vol 5, no 5
Pinatubo 15 June 1991 • Instead of plotting clearly in a field associated with ash or ice, Pinatubo volcanic cloud pixels mostly plot in a mixture region. Guo et al, 2004, G3, vol 5, no 5
El Chichón 4 April 1982 • ~7 MT fine ash • ~7 MT SO2 • ~0.3 MT sulfate • Separation of ash and SO2 striking • Ice signal may obscure limits of E side of ash cloud • Fine ash fallout >90% in 3 days Schneider et al, 1999, J Geophys Res 104: 4037-4050 Yu et al, 2000, AGU Geophys Monograph 116: 87-100
Ice dominant Schneider et al, 1999, J Geophys Res 104: 4037-4050
Conclusions • Ice is present in all cold volcanic clouds and this has important implications for hazards • Ice may be dominant, subordinate or subequal to ash in terms of mass • Sources of H2O include, magma, hydrosphere and hydrothermal systems • Ice enhances ash fallout and sequesters gases • Ice is quickly lost from stratospheric volcanic clouds
Thanks to many colleagues, students and others who did the work on which this presentation is based! Questions? William I Rose, Michigan Technological University Houghton, MI USA www.geo.mtu.edu/volcanoes/vc_web/
In this format the color of each pixel is directly related to the ash burden.
Meteorological clouds contain “hydrometeors” which are particles of H2O--either liquid water or ice. Hydrometeors selectively absorb and scatter infrared radiation which is transmitted through the cloud from the earth below.
High imaginary refractive index Volcanic Clouds which contain silicate ash selectively absorb and scatter infrared radiation, in an opposite sense to the liquid water or ice particles in met clouds.
Theoretical "net" of BTD and BT values, plotted on X-Y plot, forming a half ellipse. The individual pixel values from the volcanic cloud are plotted on the same plot in red. Corners of the ellipse are marked by temperatures of the ocean and the volcanic cloud, where the atmosphere is opaque or perfectly transparent.
Soufriére Hills, 27 Dec 1997 • Slope failure and dome collapse • Pyroclastic surge and flow went into the sea • 2 Volcanic clouds about 12-15 km high resulted--one was ash rich(red brown at left) and the other mainly ice (blue) Mayberry et al, 2003, Geol Soc London Mem 21: 539-555.