Download
1 / 24
240 likes | 339 Views
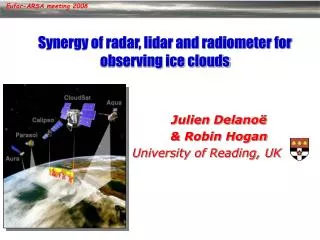
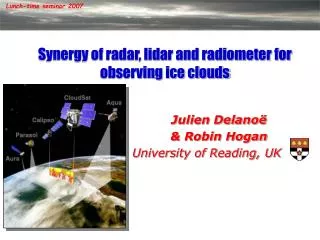
Potential alteration of ice clouds by aircraft soot. Joyce E. Penner and Xiaohong Liu Department of Atmospheric, Oceanic and Space Sciences University of Michigan Aviation, Atmosphere and Climate 30 June - 3 July 2003 Friedrichshafen, Germany.

E N D
Potential alteration of ice clouds by aircraft soot Joyce E. Penner and Xiaohong Liu Department of Atmospheric, Oceanic and Space Sciences University of Michigan Aviation, Atmosphere and Climate 30 June - 3 July 2003 Friedrichshafen, Germany
Evidence for alteration of ice clouds by aircraft emissions • Soot associated with increasing ice concentrations in regions of enhanced soot most probably due to aircraft (Ström and Ohlsson, 1998) • Trend difference in high clouds observed over regions with Computed Contrail cover > 0.5% was 3.5%/decade (land) and 1.6%/decade (ocean) between 1984 and1990 (ISCCP data) (Fahey and Schumann et al. (2001)) • Model results: • Jensen and Toon [1997] • Lohmann [2000]
Mechanisms forming ice clouds • Homogeneous nucleation • Jhaze = Jw(Teff);Teff= T+lDTm • Deposition nucleation • Js’=(4p2rN2Zse)/(2pln(kT))1/2ag2cl,sexp[-DFg,S/kT] • Fg,S=[16pMw2si/v3]/[3(RTriln Sv,i)2]f(mi,v,x); mi,v =0.9 • or: Meyer’s empirical formulation: • Nid=exp{a+b[100(RHi-1]} • Immersion nucleation • Js’=(4p2rN2kT)/(h) c1,S exp[-Dg*/(RT)-DFg,S/(kT)] • Fg.S=[16pMw2si/v3]/(3[Lm,0ri ln (T0/Te)]2) f(mi,w,x); mi,w =0.5 • Contact nucleation
Parameterization for homogeneous ice formation • T ≥ 6.07 ln w - 55.0 (fast growth; high T low w): • Ni=min{exp(a2+b2T+c2lnw)Naa1+b1T+c1lnw , Na} • T<6.07 ln w - 55.0 (slow growth; low T high w): • Ni=min{exp(a4+(b4+b5lnw) T+c4lnw)Naa3+b3T+c3lnw , Na}
Homogeneous + deposition nucleation • Lower updraft velocities and higher temperatures=> deposition nucleation only: • Threshold: T 14.387 ln(w) - 18.825; and w 0.3 m/s • Si (%) = a T + b; • where a and b are a function of w • Use with Meyer’s (1992) parameterization • Use homogeneous parameterization at higher updrafts and lower temperatures
Homogeneous, deposition, and immersion freezing • Threshold temperature for immersion, deposition freezing: • T a ln(w) + b • a, b are functions of the number of soot particles Ns • Immersion freezing: • Ni,s=min{exp(a22)Nsb22exp(bT)wc, Ns} • b, c are functions of ln Ns • Deposition freezing: • Maximum supersaturation; Simax(%) = A T2 + BT + C • A, B, C are functions of w • Number of ice crystals from Meyer’s (1992) parameterization for deposition • Use homogeneous parameterization at lower T
Immersion nucleation: ice crystal number D = -60C = -40C W=0.5 m s-1 W=-0.04 m s-1 Sulphate = 200 cm-3
Homogeneous nucleation: ice crystal number W=1.0 m s-1 W=0.04 m s-1 T=-40C T=-40C T=-60C T=-60C T=-80C T=-80C 10 100 1000 Sulfate aerosol concentration (cm-3) Sulfate aerosol concentration (cm-3)
IMPACT/DAO • Uses NASA DAO 1997 meteorological fields • Uses IPCC-recommended emissions inventories except for dust (from Ginoux for 1997 DAO winds) • Emissions put into BL for dust and biomass burning • Wet scavenging as in Harvard GEOS-CHEM model except that large scale scavenging uses 0.5 g/m3 for LWC • Dry deposition as in Zhang, Gong et al. [AE, 2001]
Unique features • DAO version has improved LWC for sulfate chemistry • GMI model is based on IMPACT • We can compare these results with more than one set of meteorological fields: • IMPACT/DAO=GMI/DAO • GMI/MACCCM3 • GMI/GISSII’
Comparison of burdens: GMI models for 1995 ff BC • Burden wet dry Lifetime • (Tg) (Tg/yr) (Tg/yr) (days) • DAO 0.058 7.17 1.75 2.40 • GISS 0.080 6.92 2.04 3.26 • NCAR 0.060 7.31 1.88 2.4 • GRANTOUR/CCM1 ffBC+bbBC: • 0.20 9.56 2.66 5.97 • DAO* 0.14 5.00 1.65 7.52
DAO GISS Fuel tracer: ng/g BC Burdens: DAO 3.3e-4 Tg GISS 5.7e-4 Tg NCAR 4.1e-4 Tg NCAR
Zonal mean ice number (cm-3), heterogeneous + homogeneous nucleation, surface sources
Difference in ice concentration between heterogeneous + homogeneous and homogeneous only (cm-3), surface sources
Concentration of ice (cm-3) Aircraft + surface sources Surface aerosol sources
Difference in ice concentration between surface + aircraft aerosol sources and surface only sources (cm-3)
Conclusion • An initial assessment of the potential impact of aircraft emissions on ice concentrations indicates significant increases (O˜100%) in zonal mean concentrations near flight corridors • Better quantification requires a better simulation of upper tropospheric humidity together with full representation of all aerosol types and their mode of nucleation