Download
1 / 10
110 likes | 775 Views
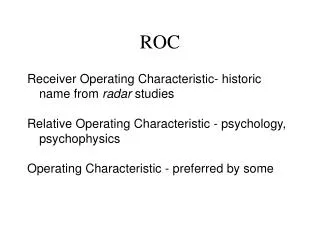
CAP and ROC curves. Cumulative Accuracy Profiles (CAP) . We first rank companies by their default probabilities (i.e., credit scores) as predicted by the model, from highest to lowest.

E N D
Cumulative Accuracy Profiles (CAP) • We first rank companies by their default probabilities (i.e., credit scores) as predicted by the model, from highest to lowest. • Then, out of those companies with a score higher than a value such that altogether they represent x% of the total number of companies, we record the corresponding number of defaulted companies being captured as a percentage (y%) of total number of defaulted companies.
CAP • The CAP curve can then be traced out by varying x from 0 to 100 and plotting the corresponding values of x and y along and x-axis and y-axis respectively. • Using a good model will result in a majority of the defaulters having relatively high default probability estimates and so the percentage of defaulters being captured (the y values in Fig. 1) increases quickly as one moves down the sorted sample of all companies (the x values in Fig. 1).
CAP • If the model were totally uninformative, for example, by assigning default probabilities randomly, we would expect to capture a proportional fraction (i.e., x% of the defaulters with about x% of the observations), resulting in a CAP curve along the 45-degree line (i.e., the “Random CAP” curve of Fig. 1).
CAP • Accuracy ratio by CAP curve= (the area under a model’s CAP)/ (the area under the ideal CAP)
Operating Characteristic Curves (ROC) • The ROC curve is constructed by varying the cutoff probability. • In particular, for every cutoff probability, the ROC curve defines the “true positive rate” (percentage of defaults that the model correctly classifies as defaults) on the y-axis as a function of the corresponding “false positive rate” (percentage of non-defaults that are mistakenly classified as defaults) on the x-axis.
The ROC curve of a constant or entirely random prediction model corresponds to the 45-degree line, whereas a perfect model will have a ROC curve that goes straight up from (0, 0) to (0, 1) and then across to (1, 1).
ROC • Accuracy ratio by ROC curve=2× (area under a model’s ROC curve-0.5)