Download
1 / 25
250 likes | 415 Views
Histopathological and Radiological Validation of Continuous Wave (CW) Near Infrared Spectroscopy (NIRS) Recordings During Cerebral Intravascular Manipulations. Daniel C. Lee, M.D. Cardiothoracic Surgery State University of New York Downstate Medical Center. Introduction.

E N D
Histopathological and Radiological Validation of Continuous Wave (CW) Near Infrared Spectroscopy (NIRS) Recordings During Cerebral Intravascular Manipulations Daniel C. Lee, M.D. Cardiothoracic Surgery State University of New York Downstate Medical Center
Introduction • Prevalent neurological complications associated with surgery • Neurocognitive impairment in 50% of patients after coronary bypass procedure - declined quality of life • 600,000 open heart procedures/year at $100,000 hospital cost per case • Neuroprotection pertinent in improving quality of life and medical economics
Introduction • Currently available intraoperative cerebral monitoring inadequate • Intracranial pressure, regional cerebral blood flow, jugular venous oxygen saturation monitoring – invasive • Sensitivity of transcranial Doppler limited by bony cranium • EEG requires trained neurologist, does not measure tissue oxygenation • Low-density NIRS oximetry neglects heterogeneity of cerebral perfusion
Introduction • Clinical need of intraoperative cerebral monitoring tool • Real-time • Temporal and spatial specificity • Identify ischemia/hypoperfusion at a reversible stage to allow countermeasures • ? NIRS tomography • Controlled cerebral ischemia studies needed for validation
Study Aim Validate capability of NIRS tomography in cerebral monitoring using a non-human primate (NHP: Bonnet Macaque) model of acute cerebral ischemia
Methods NIRS Imager: • Continuous-wave (CW), f-NIRS 3D Diffuse Optical Tomography (3D-DOT) • Two wavelengths (760 and 830 nm) • Time-series imaging: 8 Hz image framing rate • 270-channel array (30 detector optodes, 9 coupled with light sources)
Methods • Stroke model 2-3 hour unilateral microcatheter occlusion of the middle cerebral artery (MCA) of anesthetized NHP • Continuous recordings of Hbtotal, Hboxy, Hbdeoxy concentration from each channel of the array • 4×5 cm2 area in the frontal-parietal region of the exposed monkey skull • 3D image reconstruction • Post-procedure MRI and post-mortem histopathology of brain performed
Monitored Events of Interest • Intra-arterial Verapamil (vasodilator) injection • Intra-arterial contrast (OmnipaqueTM) injection • Mimicking transient ischemia • Localized acute cerebral ischemia • Subarachnoid hemorrhage (SAH)
Normal cerebral vascular anatomy and the circle of Willis (red circle). before right MCA occlusion CCA–common carotid artery ECA – external carotid artery ICA –internal carotid artery MCA – middle cerebral artery ACA – anterior cerebral artery Elements of the fNIRS optode array mounted to the animal’s cranium also are visible. fNIRS array Azygous ACA Optical fibers Left MCA Right MCA Right ICA Right CCA Right ECA Lateral Digital Subtraction Angiogram Before Microcatheter Occlusion
fNIRS optode array Intra-arterial ICA catheter occluding right MCA Anteroposterior Digital Substraction Angiogram Lateral Fluoroscopy Image confirmation of occlusion of the right MCA
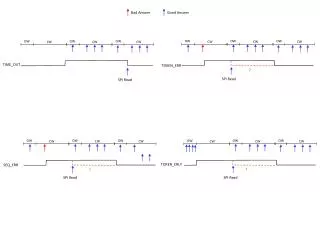
Begin Occlusion End Occlusion Right Hemisphere NIRS monitoring Optodes directly over confirmed stroke site
End occlusion Begin occlusion Left Hemisphere NIRS monitoring: optodes positioned over contralateral side
Lateral Digital Subtraction Angiogram Demonstrating Subarachnoid Hemorrhage: Internal Carotid Artery Perforation
Begin Left ICA/MCA occlusion Beginning of subarachnoid hemorrhage Contrast injection Catheter moved from right ICA to the left ICA End Left ICA/MCA occlusion Insertion of catheter in the right ICA Left Hemisphere NIRS monitoring: optodes positioned over site of acute cerebral ischemia
Start of subarachnoid hemorrhage Begin Left ICA/MCA occlusion Contrast injections Verapamil injections End of left ICA/MCA occlusion Insertion of catheter into the right ICA Catheter moved from the right ICA to the left CA Right Hemisphere NIRS monitoring optodes positioned over contralateral side
Right MCA Verapamil injection 3D DOT image reconstruction Before After Axial section Right Sagittal section
Right MCA Contrast injection3D DOT image reconstruction Before After Animation Axial section Right Sagittal section
Acute Cerebral Ischemia of the right (NHP-1) and left (NHP-2) hemispheres Before [NHP-1] After Before [NHP-2] After Axial section Coronal section
Diffuse Bilateral Subarachnoid Hemorrhage (SAH) Before [NHP-1] After Before [NHP-2] After Axial section Coronal section
Diffuse Bilateral Subarachnoid Hemorrhage (SAH) Before After Animation Axial section
R L R L Coronal FLAIR MRI sequences (NHP-2) Confirmation of: 1) ischemia (dotted circle) in the left temporal and inferior frontal lobe; 2) the presence of SAH (arrow points).
A) SAH present in the sulci. B) Hemorrhage in subarachnoid space (>) and vasculature ( ). C, D) Vacuolization of neuropil () and shrunken neurons with hypereosinophilic cytoplasm (◄) indicate acute ischemic damage. Gross pathology and histologic findings for NHP-1.
A) Subarachnoid hemorrhage over the brainstem and Circle of Willis. B) Subarachnoid hemorrhage in the sulci. C) Photomicrograph of the hemorrhage in the subarachnoid space ( >) Gross pathology and histologic findings for NHP-2.
Conclusions • NIRS Tomography accurately captured cerebral ischemia, vasodilatation, and hemorrhage in an experimental primate model in real time, with spatial and temporal specificity • Utilization for cerebral monitoring in a clinical setting (intraoperative, trauma/critical care) may be promising
Acknowledgments • Surgery • Tigran Gevorgyan, John Kral • Pathology • Douglas Pfeil, Harry Graber, Yong Xu, Jenny Libien, Randall Barbour • Interventional Neuroradiology • Sundeep Mangla • Neurology • Frank Barone • Anesthesia • Jean Charchaflieh • This research was supported by the National Institutes of Health under Grants nos. R21NS067278, R42NS050007 and R44NS049734; by the Defense Advanced Research Projects Agency (DARPA) project N66001-10-C-2008; and by New York State Department of Health ECRIP Grants to Randall Barbour and Daniel Lee.