Download
1 / 22
230 likes | 511 Views
Process Improvement and Process Capability. © Christian Terwiesch 2003. Yield of Resource=. Yield of Process=. The Concept of Yields. 90%. 80%. 90%. 100%. 90%. Line Yield: 0.9 x 0.8 x 0.9 x 1 x 0.9. Rework / Elimination of Flow Units.

E N D
Process Improvement and Process Capability © Christian Terwiesch 2003
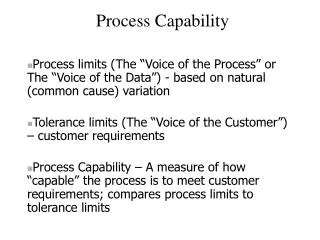
Yield of Resource= Yield of Process= The Concept of Yields 90% 80% 90% 100% 90% Line Yield: 0.9 x 0.8 x 0.9 x 1 x 0.9
Rework / Elimination of Flow Units Rework: Defects can be corrected Same or other resource Leads to variability Examples: - Readmission to ICU - Toyota case Step 1 Test 1 Step 2 Test 2 Step 3 Test 3 Rework Step 1 Test 1 Step 2 Test 2 Step 3 Test 3 Loss of Flow units: Defects can NOT be corrected Leads to variability To get X units, we have to start X/y units Examples: - Interviewing - Semiconductor fab Step 1 Test 1 Step 2 Test 2 Step 3 Test 3
The Concept of Consistency:Who is the Better Target Shooter? Not just the mean is important, but also the variance Need to look at the distribution function
The Impact of Variation on Quality: The Xootr Case Variation is (again) the root cause of all evil
Two Types of Causes for Variation Common Cause Variation (low level) Common Cause Variation (high level) Assignable Cause Variation • Need to measure and reduce common cause variation • Identify assignable cause variation as soon as possible
Statistical Process Control: Control Charts • Track process parameter over time - mean - percentage defects • Distinguish between - common cause variation (within control limits) - assignable cause variation (outside control limits) • Measure process performance: how much common cause variation is in the process while the process is “in control”? Process Parameter Upper Control Limit (UCL) Center Line Lower Control Limit (LCL) Time
The X-bar Chart: Application to Call Center • Collect samples over time • Compute the mean: • Compute the range: as a proxy for the variance • Average across all periods - average mean - average range • Normally distributed
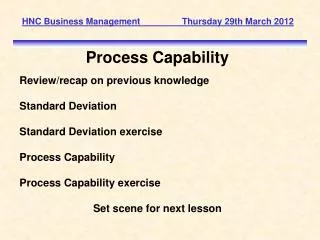
12 10 8 6 4 2 0 1 3 5 7 9 11 13 15 17 19 21 23 25 27 Control Charts: The X-bar Chart • Define control limits • Constants are taken from a table • Identify assignable causes: - point over UCL - point below LCL - many (6) points on one side of center • In this case: - problems in period 13 - new operator was assigned
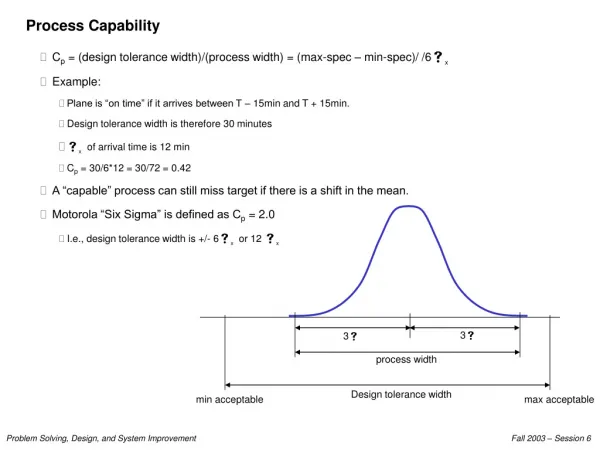
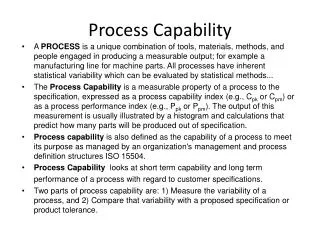
The Statistical Meaning of Six Sigma X+6sB X X-6sB X+3sA X+2s X+1sA X X-3sA X-2sA X-1sA s ˆ R Process capability measure Upper Specification Limit (USL) Lower Specification Limit (LSL) Process A (with st. dev sA) x Cp P{defect}ppm 1 0.33 0.317 317,000 2 0.67 0.0455 45,500 3 1.00 0.0027 2,700 4 1.33 0.0001 63 5 1.67 0.0000006 0,6 6 2.00 2x10⁻⁹ 0,00 3 Process B (with st. dev sB) • Estimate standard deviation: • Look at standard deviation relative to specification limits • Don’t confuse control limits with specification limits: a process can be out of control, yet be incapable = / d 2
Attribute Based Control Charts: The p-chart =0.052 UCL= + 3 LCL= - 3 = s s s ˆ ˆ ˆ Period n defects p • Estimate average defect percentage • Estimate Standard Deviation • Define control limits • DAV case: - calibration period (capability analysis) - conformance analysis =0.013 =0.091 =0.014
Statistical Process Control Capability Analysis Conformance Analysis Eliminate Assignable Cause Investigate for Assignable Cause • Capability analysis • What is the currently "inherent" capability of my process when it is "in control"? • Conformance analysis • SPC charts identify whencontrol has likely been lost and assignable cause variation has occurred • Investigatefor assignable cause • Find “Root Cause(s)” of Potential Loss of Statistical Control • Eliminate or replicate assignable cause • Need Corrective Action To Move Forward
How do you get to a Six Sigma Process? Step 1: Do Things Consistently (ISO 9000) 1. Management Responsibility 2. Quality System 3. Contract review 4. Design control 5. Document control 6. Purchasing / Supplier evaluation 7. Handling of customer supplied material 8. Products must be traceable 9. Process control 10. Inspection and testing 11. Inspection, Measuring, Test Equipment 12. Records of inspections and tests 13. Control of nonconforming products 14. Corrective action 15. Handling, storage, packaging, delivery 16. Quality records 17. Internal quality audits 18. Training 19. Servicing 20. Statistical techniques Examples: “The design process shall be planned”, “production processes shall be defined and planned”
Step 2: Reduce Variability in the ProcessThe Idea of Taguchi: Even Small Deviations are Quality Losses Quality Quality Loss Loss = C(x-T)2 Performance Metric, x Good Performance Metric Bad Maximum acceptable value Minimum acceptable value Target value Target value It is not enough to look at “Good” vs “Bad” Outcomes Only looking at good vs bad wastes opportunities for learning; especially as failures become rare (closer to six sigma) you need to learn from the “near misses” Catapult: Land “in the box” opposed to “perfect on target”
Step 3: Accommodate Residual Variability Through Robust Design Chewiness of Brownie=F1(Bake Time) + F2(Oven Temperature) F1 F2 Bake Time Oven Temperature 350 F 25 min. 30 min. 375 F Design A Design B • Double-checking (see Toshiba) • Fool-proofing, Poka yoke (see Toyota) • Process recipe (see Brownie) Pictures from www.qmt.co.uk
The Case of Jesica Santillam Jesica Santillam, 17, has waited three years for donor organs to become available. (Photo: AP) • Line of Causes leading to the mismatch • Jaggers did not take home the list of blood types • Coordinator initially misspelled Jesica’s name • Once UNOS identified Jesica, no further check on blood type • Little confidence in information system / data quality • Pediatric nurse did not double check • Harvest-surgeon did not know blood type
The Case of Jesica Santillam (ctd) “We didn’t have enough checks”, Ralph Snyderman, Duke University Hospital Not the first death in organ transplantation because of blood type mismatch As a result of this tragic event, it is clear to us at Duke that we need to have more robust processes internally and a better understanding of the responsibilities of all partners involved in the organ procurement process," said William Fulkerson, M.D., CEO of Duke University Hospital.
Why Having a Process is so Important:Two Examples of Rare-Event Failures • Case 1: Process does not matter in most cases • Airport security • Safety elements (e.g. seat-belts) “Bad” outcome only happens Every 10 Mio units 1 problem every 10,000 units 99% correct • Case 2: Process has built-in rework loops • Double-checking • Jesica’s case 99% Good 99% 99% 1% Bad 1% 1% “Bad” outcome only happens with probability (1-0.99)3 Learning should be driven by process deviations, not by defects
The Three Steps in the Case of Jesica Step 1: Define and map processes - Jaegger had probably forgotten the list with blood groups 20 times before - Persons involved in the process did not double-check, everybody checked sometimes - Learning is triggered following deaths / process deviations are ignored Step 2: Reduce variability - quality of data (initially misspelled the name) Step 3: Robust Design - color coding between patient card / box holding the organ - information system with no manual work-around
To End with a Less Sad Perspective: Predicting Distance can be Important… © www.jochen-schweizer.de