Download
1 / 15
260 likes | 702 Views
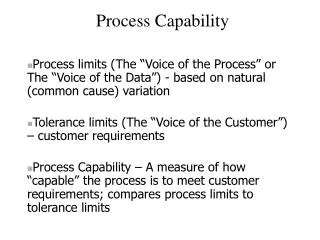
Process Capability. Process capability For Variables The 6 versus specification limits For attributes Pareto chart Cause and effect diagram. Process Capability. There is a difference between a process conforming to the specifications and a process performing within statistical limits

E N D
Process Capability • Process capability • For Variables • The 6 versus specification limits • For attributes • Pareto chart • Cause and effect diagram
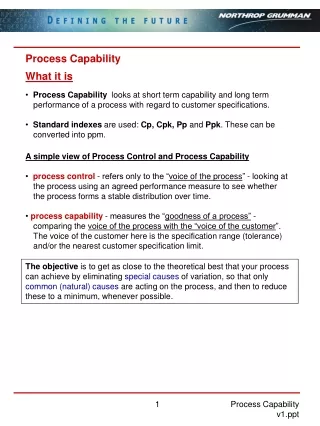
Process Capability • There is a difference between a process conforming to the specifications and a process performing within statistical limits • A process in statistical control will not necessarily meet specifications as established by the customer • The control limits on the charts represent what the process is capable of producing
Process Capability • Specifications are set by the customer. These are the “wishes.” • Control limits are obtained by applying statistical rules on the data generated by the process. These are the “reality.” • Process capability refers to the ability of a process to meet the specifications set by the customer or designer
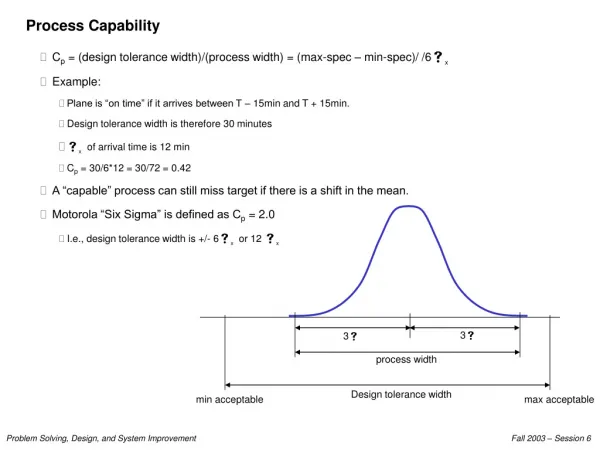
The 6 Versus Specification Limits • It is important to compare the natural tolerances, 6, with the specification range (USL-LSL). • Recall that may be estimated as follows:
The 6 Versus Specification Limits • Suppose that process mean = (USL+LSL)/2 • Case I: 6 < USL - LSL • The specifications will be met even after a slight shift in process mean • Case II: 6 = USL - LSL • As long as the process remains in control with no change in process variation, the specification will be met • Case III: 6 > USL - LSL • Although the process may be in statistical control, it is incapable of meeting specifications
The 6 Versus Specification Limits • Capability potential • The relationship between process mean, and its target value, is obtained from an index • Exercise: If the target mean value = (USL+LSL)/2, is the process capable if
Process Capability • Some indices: • If the above indices are more than 1, the 3-sigma control limits are within the specification limits, and the process is capable - all but at most 0.27% items meet the specification • If CpL < 1, too many items are outside LSL • If CpU < 1, too many items are outside USL
The 6 Versus Specification Limits • Sometimes, only one of CpL and CpU may be relevant e.g., testing for steel hardness • If the process is not capable, actions may be taken to adjust the • process mean • variation • specifications
Problem 9.6: A certain manufacturing process has been operating in control at a mean of 65.00 mm with upper and lower control limits on the chart of 65.225 and 64.775 respectively. The process standard deviation is known to be 0.15 mm, and specifications on the dimensions are 65.00±0.50 mm. (a) What is the probability of not detecting a shift in the mean to 64.75 mm on the first subgroup sampled after the shift occurs. The subgroup size is four. (b) What proportion of nonconforming product results from the shift described in part (a)? Assume a normal distribution of this dimension. (c) Calculate the process capability indices Cp and Cpk for this process, and comment on their meaning relative to parts (a) and (b).
50 40 30 20 10 0 100 80 60 40 20 0 Cumulative percentage Number of defects Pareto Chart
50 40 30 20 10 0 100 80 60 40 20 0 C Cumulative percentage Number of defects D A B Defect type Pareto Chart
50 40 30 20 10 0 100 80 60 40 20 0 C Cumulative percentage Number of defects D A B Defect type Pareto Chart
Cause and Effect Diagram Measurement Men/Women Machines Out of adjustment Poor supervision Faulty testing equipment Lack of concentration Tooling problems Incorrect specifications Improper methods Old / worn Inadequate training Quality Problem Inaccurate temperature control Poor process design Defective from vendor Ineffective quality management Not to specifications Dust and Dirt Material- handling problems Deficiencies in product design Environment Materials Methods
Cause and Effect Diagram • Common categories of problems in manufacturing • 5 M’s and an E • Machines, methods, materials, men/women, measurement and environment • Common categories of problems in service • 3 P’s and an E • Procedures, policies, people and equipment
Reading and Exercises • Chapter 9: • pp. 324-330 (Section 9.2) • 9.1, 9.5