Download
1 / 25
320 likes | 650 Views
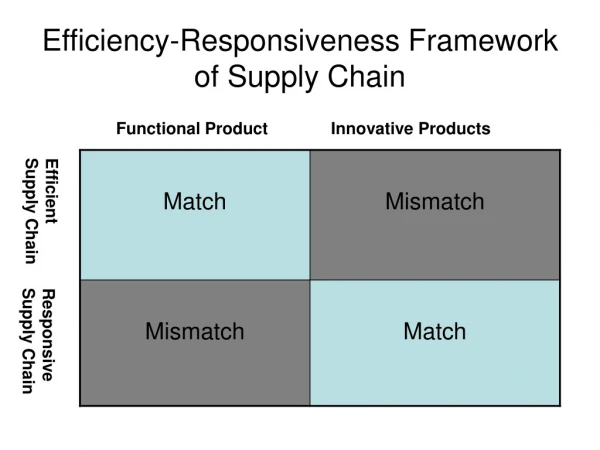
Managing Uncertainty in the Supply Chain: Safety Inventory. The Role of Safety Inventory. Forecasts are rarely completely accurate If average demand is 1000 units per week, then half the time actual demand will be greater than 1000, and half the time actual demand will be less than 1000.

E N D
The Role of Safety Inventory • Forecasts are rarely completely accurate • If average demand is 1000 units per week, then half the time actual demand will be greater than 1000, and half the time actual demand will be less than 1000. • If you kept only enough inventory in stock to satisfy average demand, half the time you would run out • Safety inventory: Inventory carried for the purpose of satisfying demand that exceeds the amount forecasted in a given period
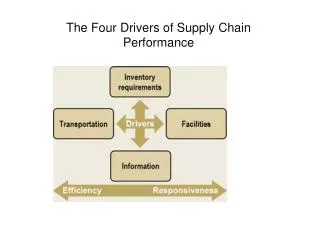
ROP=Expected demand during lead time+ Safety Stock =Expected demand during lead time+ Reorder Point Service level Risk of a stockout Probability of no stockout ROP Expected demand Demand quantity Safety stock
Role of Safety Inventory • Average inventory is therefore cycle inventory plus safety inventory • There is a fundamental tradeoff: • Raising the level of safety inventory provides higher levels of product availability and customer service • Raising the level of safety inventory also raises the level of average inventory and therefore increases holding costs • Very important in high-tech or other industries where obsolescence is a significant risk (where the value of inventory, such as PCs, can drop in value)
Two Questions to Answer in Planning Safety Inventory • What is the appropriate level of safety inventory to carry? • What actions can be taken to improve product availability while reducing safety inventory?
Measuring Product Availability • Product availability: a firm’s ability to fill a customer’s order out of available inventory • Stockout: a customer order arrives when product is not available • Product fill rate (fr): fraction of demand that is satisfied from product in inventory. It is equivalent to the probability that product demand is supplied from available inventory. • Order fill rate: fraction of orders that are filled from available inventory • Cycle service level (CSL): fraction of replenishment cycles that end with all customer demand met. It is equal to the probability of not having a stockout in a replenishment cycle.
L: Lead time for replenishment D: Average demand per unit time D:Standard deviation of demand per period DL:Mean demand during lead time L: Standard deviation of demand during lead time CSL: Cycle service level ss: Safety inventory ROP: Reorder point Continuous Review Policy: Safety Inventory and Cycle Service Level Average Inventory = Q/2 + ss
Quantity ROP Safety stock Time LT Safety Stock Safety stock reduces risk of stockout during lead time
Service level Risk of a stockout Probability of no stockout Quantity ROP Expected demand Safety stock 0 z z-scale Reorder Point The ROP based on a normal Distribution of lead time demand
Example 1: Estimating Safety Inventory (Continuous Review Policy) Assume that weekly demand for Palms at B&M Computer World is normally distributed with a mean of 2500 and a standard deviation of 500. The manufacturer takes two weeks to fill an order placed by the B&M manager. The store manager currently orders 10,000 palms when the inventory on hand drops to 6000. evaluate the safety inventory carried by B&M and the average inventory carried by B&M. Also evaluate the average time spent by a Palm at B&M. D = 2,500/week; D = 500 L = 2 weeks; Q = 10,000; ROP = 6,000 DL = DL = (2500)(2) = 5000 ss = ROP - DL = 6000 - 5000 = 1000 Cycle inventory = Q/2 = 10000/2 = 5000 Average Inventory = cycle inventory + ss = 5000 + 1000 = 6000
Example 2: Estimating Cycle Service Level (Continuous Review Policy) Weekly demand for Palms at B&M is normally distributed with a mean of 2500 and a standard deviation of 500. The replenishment lead time is two weeks. Assume that the demand is independent from one week to the next. Evaluate the CSL resulting from a policy of ordering 10,000 Palms when there are 6,000 Palms in inventory. D = 2,500/week; D =500 L = 2 weeks; Q = 10,000; ROP = 6,000 Cycle service level, CSL = F(DL + ss, DL, L) = = NORMDIST (DL + ss, DL, L) = NORMDIST(6000,5000,707,1) = 0.92 (This value can also be determined from a Normal probability distribution table)
Impact of Required Product Availability and Uncertainty on Safety Inventory • Desired product availability (cycle service level or fill rate) increases, required safety inventory increases • Demand uncertainty (sL) increases, required safety inventory increases • Managerial levers to reduce safety inventory without reducing product availability • reduce supplier lead time, L (better relationships with suppliers) • reduce uncertainty in demand, sL (better forecasts, better information collection and use)
Impact of Supply Uncertainty • D: Average demand per period • D: Standard deviation of demand per period • L: Average lead time • sL: Standard deviation of lead time
Example 3 • Average demand per periodD= 2,500 • Standard deviation of demand per period D=500 • Average lead time L=7 days • Standard deviation of lead time sL=7 days
Table 1: Required Safety Inventory as a Function of Lead Time Uncertainty sL L ss (units) ---------------------------------------------------------- • 15,058 19,298 • 12,570 16,109 4 10,087 12,927 • 7,616 9,760 2 5172 6628 1 2828 3625 0 1323 1695
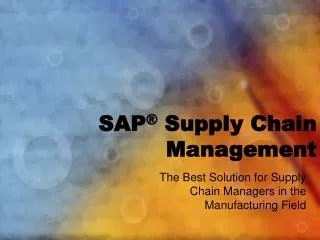
Impact of Aggregationon Safety Inventory • Models of aggregation • Information centralization • Specialization • Product substitution • Component commonality • Postponement
Aggregation (Inventory Pooling) • Consider these two systems: 30 20 Market One Warehouse One Supplier 10 20 Warehouse Two Market Two 30 40 Market One Warehouse Supplier 10 Market Two
Aggregation (Inventory Pooling) • For the same service level, which system will require more inventory? • For the same total inventory level, which system will have better service?
Impact of Aggregation (when individual demands are independent)
Impact of Aggregation(Example 4) Car Dealer : 4 dealership locations (disaggregated) D = 25 cars; sD = 5 cars; L = 2 weeks; desired CSL=0.90 What would the effect be on safety stock if the 4 outlets are consolidated into 1 large outlet (aggregated)? At each disaggregated outlet: For L = 2 weeks, sL = 7.07 cars ss = Fs-1(CSL) x sL = Fs-1(0.9) x 7.07 =NORMSINV(0.9)*7.07 = 9.06 Each outlet must carry 9 cars as safety stock inventory, so safety inventory for the 4 outlets in total is (4)(9) = 36 cars
Impact of Aggregation (when individual demands are independent)(Example 4) One outlet (aggregated option): DC = D1 + D2 + D3 + D4 = 25+25+25+25 = 100 cars/wk sDC= Sqrt(52 + 52 + 52 + 52) = 10 (if r = 0) sLC = sDC Sqrt(L) = (10)Sqrt(2) = (10)(1.414) = 14.14 ss = Fs-1(CSL) x sLC = Fs-1(0.9) x 14.14 =18.12 or about 18 cars If r does not equal 0 (demand is not completely independent).
Information Centralization • Virtual aggregation • Information system that allows access to current inventory records in all warehouses from each warehouse • Most orders are filled from closest warehouse • In case of a stockout, another warehouse can fill the order • Examples: McMaster-Carr, Gap, Wal-Mart
Product Substitution • Substitution: use of one product to satisfy the demand for another product
Component Commonality • Using common components in a variety of different products