Download
1 / 45
760 likes | 2.14k Views
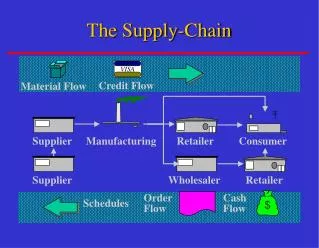
Benchmarking the Supply Chain. Outline. Benchmarking the supply chain Supply chain mapping and throughput efficiency Supplier and distributor benchmarking Supply-Chain Operations Reference Model Managing the supply chain of the future - the new organizational paradigm

E N D
Outline • Benchmarking the supply chain • Supply chain mapping and throughput efficiency • Supplier and distributor benchmarking • Supply-Chain Operations Reference Model • Managing the supply chain of the future - the new organizational paradigm • The seven principles of supply chain management
What is Benchmarking? Competitive Benchmarking is the continuous measurement of the company’s products, services, processes and practices against the standards of best competitors and other companies who are recognized as leaders Who are doing it? • Xerox started the practice in 1981, then became popular in all major international companies, e.g. Motorola • There are international organizations specialized in this service, e.g., Global Benchmarking Council, American Productivity and Quality Center • Asian Benchmarking Clearinghouse, Hong Kong Benchmarking Clearinghouse
Key Consideration Dimensions in Logistics Benchmarking • Logistics output, i.e., achieving customer service goals and customer’s perception of performance • Performance should be compared to the ‘best of the class’. Don’t limit your effort to players inside the industry only! • Logistics processes, i.e., not enough to just measure the output, processes which generate the output should also be measured!
Benefits of Benchmarking • Enable best practices from any industry to be creatively incorporated into the benchmarked process • Provide stimulation and motivation to professionals involved in implementing benchmarked findings • Breaks down ingrained reluctance to change (more receptive to ideas from another industry) • May identify technological breakthroughs from other industries (e.g. bar-coding)
Benchmarking Logistics Process Key Steps • Understand the structure of the process, i.e., process mapping, process analysis, flow charts • Identify the critical processing steps, i.e., process bottlenecks, critical path • Benchmark those critical processing steps against ‘best in class’ • Measure performance at supplier/customer interface • Derive the most effective processes and adopt the best control and measurement tools
Sales and Customer Shipping marketing order customer function status order Accounting Back Invoicing order Inventory available Inventory Process file order Warehouse Credit withdrawal Customer checking Order Shipping Transport Production documents scheduling Production Material schedule procurement Understand the Process
Sales and Customer Shipping marketing order customer function status order Accounting Back Invoicing order Inventory available Inventory Process file order Warehouse Credit withdrawal Customer checking Order Shipping Transport Production documents scheduling Production Material schedule procurement Identify Critical Points Customer Service Inventory Mgmt Order fulfillment Production Mgmt Supplier Mgmt
Benchmark against ‘Best in Class’ Supplier Performance & Mat. Inv. Service level performance Inventory availability Perfect order fulfillment Consumer satisfaction Production plan vs actual Supplier Mgmt Inventory Mgmt CustomerService End user Prod. Mgmt Order Fulfill
Practices Uncovered by Xerox via Non-competitive Benchmarking
Value-added time X 100 End-to-end pipeline time Throughput Efficiency • Value-adding time is time spent doing something which creates a benefit for customer (i.e., the right product in the right place and at the right time) • Non-value-adding time is time spent on activities that can be eliminated with no reduction in benefit to the customer • Throughput efficiency is defined as:
100% Throughput efficiency is only around 25%! Shipping Ship to customer Secondary conversion Packaging 50% Primary conversion Distribution center pick Inbound material Supplier lead time 10% 26 38 2 6 10 14 18 22 30 34 Value Added Through Time % of Total Value Added Weeks in Supply Chain
50 No of Variety 25 5 26 38 2 6 10 14 18 22 30 34 Weeks in Supply Chain Product Variety Through Time Packaging 2nd Conversion
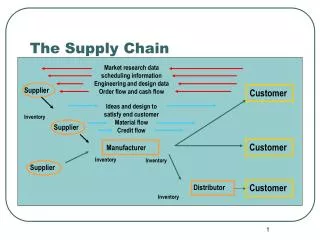
Supply Chain Map A time-based representation of the processes and activities involved as the materials/products move through the supply chain. • Horizontal time – time spent in process (manufacturing, transit, assembly/packaging, etc.) • Time required for system to respond to increase in demand • Vertical time – time spent by product/WIP standing as inventory • (Horizontal + vertical time) = time required to ‘drain’ system of inventory • Multi-component products – total pipeline determined by the slowest moving item
Fiber store (20) Finished goods store (20) Grey stock (15) DC (15) Yarn finished store (10) Raw material (10) Store (10) Yarn store (5) (5) (5) Spinning (15) (7) (2) Commodity market (2) Sewing (18) End user Knitting (10) Component cutting (5) Dyeing & finishing Finished fabric Spinning Fabric supplier Manufacturer Retailer Pipeline Mapping Length 60 days Volume 175 days
How to Use Supply Chain Mapping • It provides a powerful basis for logistics reengineering projects • It makes the total process and its associated inventory transparent • It measures product or service supply chain efficiency (i.e., value-added vs. non-value-added time) • It highlights the consequences of some ‘rules’ and ‘policies’ the company is imposing (or has inherited) in the areas of inventory, purchasing, production planning, and vendor management
Assignment? • Define the supply chains of the products or services for the company you are working for. And map out those supply chains suing the tools learnt in this class; • Calculate the supply chain efficiency of your company, and benchmark it against other players in the industry; • Identify issues in the supply chain and propose reengineering projects for the company.
Supplier and Distributor Benchmarking In reviewing your supplier and distributor relationship and benchmark it against the ‘best in class’, the emphasis should be on assessing their contribution to overall supply chain performance (efficiency and effectiveness). Some of the key issues are: • willingness to work as a partner / co-maker • commitment to continuous improvement • acceptance of innovation and change • focus on throughput time reduction • utilization of quality management procedures • use regular and formal benchmarking processes themselves • do they seek to improve communication with you? • are they flexible? Customer-focused?
Interfaces Supplier Internal Distributor e.g. Quality On-time performance Stock availability e.g. Throughput times On-time performance Stock availability e.g. Value-added services Customer concern Delivery performance e.g. Communications Schedule integration Co-makership e.g. Communications Requirements planning Partnership Supplier and Distributor Benchmarking - some typical measures
Setting Benchmarking Priorities • Which processes and entities in the supply chain are of strategic importance • Which processes and entities have a high relative impact on the business economics (costs, revenue, asset performance, and human productivity) • Where there is a choice between ‘make’ and ‘buy’ (processes of high impact on performance /productivity and hard to source from suppliers) • Where there is internal readiness to change
Who to Benchmark against? • The Supply Chain Council represents a wide spectrum of industries and other related institutions (700+ members) • Supply Chain Operations Reference-model (SCOR) • Council of Logistics Management The CLM has more than 10,000 members and hosts one of the most valuable Annual Conferences in the field • Institute of Logistics and Transport The ILT has over 24,000 members, forged by the merger of two UK Logistics & Transport entities in May 1999 • International Warehouse Logistics Association The IWLA has over 550 members including 3PL, 4PL, public and contract warehouses as well as their suppliers
The Balance Scorecard Identify key performance indicators for management to meet strategic goals • Articulate logistics and supply chain strategy • To fit with overall corporate and marketing goals • What are the measurable outcomes of success? • “Better, faster, cheaper” • What are the processes that impact these outcomes? • Processes leading to better “order achievement”, shorter pipelines, lower costs • What are the drivers of performance within these outcomes? • Identify by “cause-and-effect” analysis, devise measurement indices
Supply Chain Operations Reference-model (SCOR) • Build around five major processes: Plan, Source, Make, Deliver and Return, as the cross-industry standard for supply chain management • Provides a standard way to measure supply chain performance and to use common metrics to benchmark against other organisations • The model is regularly updated based on most recent study and research results. The latest version is V5.0. • The Supply Chain Council provides regular workshop for its members to understand the model • Website address: www.supply-chain.org
What is a Process Reference Model? Process reference models integrate the well-known concepts of business process reengineering, benchmarking, and process measurement into a cross-functional framework. A Process Reference Model can: • Capture the "as-is" state of a process and derive the desired "to-be" future state • Quantify the operational performance of similar companies and establish internal targets based on "best-in-class" results • Characterize the management practices and software solutions that result in "best-in-class" performance
What Does a Process Reference Model Contains? • Standard descriptions of management processes • A framework of relationships among the standard processes • Standard metrics to measure process performance • Management practices that produce best-in-class performance • Standard alignment to software features and functionality
How Can a Process Reference Model be Used? Once a Complex Management Process is captured in Standard Process Reference Model form, it can be: • Implemented purposefully to achieve competitive advantage • Described unambiguously and communicated • Measured, managed, and controlled • Tuned and re-tuned to a specific purpose A powerful management tool
SCOR: Three levels of process detail • Top level • Defines the scope and content for the SCOR model • Basis of competition performance target set • Configuration level • Representation of the company’s supply chain using 30 core “process categories” • Process Element level • Defines company’s ability to compete in chosen market • Process element definitions, inputs, outputs, systems/tools; • Performance metrics, best practices, systems capabilities • Implementation level • Defines practices to achieve competitive advantage and adapt to change
SCOR Level 1: Core Process Definitions • Plan • Processes that balance aggregate supply and demand to develop strategies to best meet sourcing, production and delivery requirements • Source • Processes that procure goods and services to meet demand • Make • Processes that transform product to a finished state to meet planned or actual demand • Deliver • Processes that provide finished goods or services to meet demand (order management, transportation, distribution) • Return • Processes associated with returning or receiving returned products; post-delivery customer support
SCOR Level 2: Each SCOR process can be further described by process type: • Planning • Balance aggregated demand and supply • Occur at regular intervals, consistent planning horizon • Contribute to supply-chain response time • Execution • Scheduling/sequencing, transform product and/or moving product • Contribute to order fulfilment cycle time • Enable • Prepares, maintains, or manages information or relationships on which planning and execution processes rely “SCOR Configuration Toolkit” • 30 categories of process-type combinations
SCOR configurability A supply-chain configuration is driven by: • Plan levels of aggregation and information sources • Source locations and products • Make production sites and methods • Deliver channels, inventory deployment and products • Return locations and methods SCOR must accurately reflect how a supply-chain’s configuration impacts management processes and practices. • Each intersection of two execution processes (Source-Make-Deliver) is a “link” in the supply chain • Each process is a customer of the previous process and a supplier to the next • Every link requires an occurrence of a plan process category
Configuring supply chain threads Each thread can be used to describe, measure, and evaluate supply-chain configurations. 1. Select the business entity to be modelled (e.g. product set) 2. Illustrate the physical locations of: • Production facilities (Make) • Distribution activities (Deliver) • Sourcing activities (Source) 3. Illustrate primary point-to-point material flows using “solid line” arrows 4. Place the most appropriate Level 2 execution process categories to describe activities at each location 5. Describe each distinct supply-chain “thread” (the set of Source-Make-Deliver supply-chain processes) to understand common, and distinct, execution process categories 6. Place planning process categories (using dashed lines) to show links with execution processes
Managing the Supply Chain of the Future - the new organizational paradigm
CLM Study: How the Leading-edge Firms Manages Logistics? • Concerning organization structure, leading-edge firms: • Have had formal logistics organization longer • Are more apt to have logistics headed by an officer-level executive • Adopt a more fluid approach to logistics organization and encourage frequent re-org to take advantage of opportunities that arise • Tend to favor centralized control • Are more apt to execute boundary-spanning or externally-oriented logistics functions
CLM Study: How the Leading-edge Firms Manages Logistics? • Concerning strategic posture, leading-edge firms: • Have a greater tendency to manage logistics as a value-added process • Reflect a stronger commitment to achieving and maintaining customer satisfaction • Place a premium on flexibility, particularly in regard to accommodating special or non-routine requests • Are better positioned to handle unexpected events • Are more willing to use outside service providers • Are more apt to view service provider relationship as strategic alliance
CLM Study: How the Leading-edge Firms Manages Logistics? • Concerning managerial behavior, leading-edge firms: • Expend more effort on formal logistics planning • Are more apt to publicize their performance commitments and standards • Are more apt to have chief logistics officers involved in business strategic planning • Respond effectively to non-planned events • Regularly use a wider range of performance measures, including asset mgmt, cost, customer service, productivity, … • Invest in state-of-the-art information technology
New Logistics Organization Paradigm • From functions to processes • From profit to performance • From products to customers • From inventory to information • From transaction to relationship
Seven Principles of Supply Chain Management • Segment customers based on service needs • Customize the logistics network • Listen to signals of market demand and plan accordingly • Differentiate product closer to the customer • Source strategically • Develop a supply chain-wide technology strategy • Adopt channel-spanning performance measures
Summary of Learning Objectives • Benchmarking the supply chain • Supply chain mapping and throughput efficiency • Supplier and distributor benchmarking • SCOR • Managing the supply chain of the future - the new organizational paradigm • The seven principles of supply chain management
References Christopher, M., Logistics and Supply Chain Management, 2nd edition, FT-PrenticeHall, 1998. Kaplan, R.S. and Norton, D.P., The Balanced Scorecard, Harvard Business School Press, 1996. “Supply-Chain Operations Reference-model: Overview of SCOR Version 5.0”, Supply Chain Council, Inc., 2001. Shapiro, B., V.K. Rangan and J.V. Sviokla, “Staple yourself to an order”, Harvard Business Review, July-August, 1992.