Download
1 / 34
430 likes | 1.38k Views
Inventory Management and Risk Pooling (2). Designing & Managing the Supply Chain Chapter 3 Byung-Hyun Ha bhha@pusan.ac.kr. Outline. Introduction to Inventory Management The Effect of Demand Uncertainty (s,S) Policy Supply Contracts Periodic Review Policy Risk Pooling

E N D
Inventory Management and Risk Pooling (2) Designing & Managing the Supply Chain Chapter 3 Byung-Hyun Ha bhha@pusan.ac.kr
Outline • Introduction to Inventory Management • The Effect of Demand Uncertainty • (s,S) Policy • Supply Contracts • Periodic Review Policy • Risk Pooling • Centralized vs. Decentralized Systems • Practical Issues in Inventory Management
Supply Contracts • Assumptions for Swimsuit production • In-house manufacturing Usually, manufactures and retailers • Supply contracts • Pricing and volume discounts • Minimum and maximum purchase quantities • Delivery lead times • Product or material quality • Product return policies
Fixed Production Cost =$100,000 Variable Production Cost=$35 Selling Price=$125 Salvage Value=$20 Manufacturer DC Manufacturer Retail DC Stores Supply Contracts • Condition Wholesale Price =$80
Demand Scenario and Retailer Profit • Sequential supply chain • Retailer optimal order quantity is 12,000 units • Retailer expected profit is $470,700 • Manufacturer profit is $440,000 • Supply Chain Profit is $910,700 • Is there anything that the distributor and manufacturer can do to increase the profit of both? • Global optimization?
Buy-Back Contracts • Buy back=$55 retailer manufacturer
Buy-Back Contracts • Sequential supply chain • Retailer optimal order quantity is 12,000 units • Retailer expected profit is $470,700 • Manufacturer profit is $440,000 • Supply Chain Profit is $910,700 • With buy-back contracts • Retailer optimal order quantity is 14,000 units • Retailer expected profit is $513,800 • Manufacturer expectedprofit is $471,900 • Supply Chain Profit is $985,700 • Manufacture sharing some of risk!
Revenue-Sharing Contracts • Wholesale Price from $80 to $60, RS 15% • Supply Chain Profit is $985,700 retailer manufacturer
Other Types of Supply Contracts • Quantity-flexibility contracts • Supplier providing full refund for returned (unsold) items up to a certain quantity • Sales rebate contracts • Direct incentive to retailer by supplier for any item sold above a certain quantity • … • Consult Cachon 2002
Global Optimization • What is the most profit both the supplier and the buyer can hope to achieve? • Assume an unbiased decision maker • Transfer of money between the parties is ignored • Allowing the parties to share the risk! • Marginal profit=$90, marginal loss=$15 • Optimal production quantity=16,000 • Drawbacks • Decision-making power • Allocating profit
Global Optimization • Revised buy-back contracts • Wholesale price=$75, buy-back price=$65 • Global optimum • Equilibrium point! • No partner can improve his profit by deciding to deviate from the optimal decision • Consult Ch14 of Winston, “Game theory” • Key Insights • Effective supply contracts allow supply chain partners to replace sequential optimization by global optimization • Buy Back and Revenue Sharing contracts achieve this objective through risk sharing
Supply Contracts: Case Study • Example: Demand for a movie newly released video cassette typically starts high and decreases rapidly • Peak demand last about 10 weeks • Blockbuster purchases a copy from a studio for $65 and rent for $3 • Hence, retailer must rent the tape at least 22 times before earning profit • Retailers cannot justify purchasing enough to cover the peak demand • In 1998, 20% of surveyed customers reported that they could not rent the movie they wanted
Supply Contracts: Case Study • Starting in 1998 Blockbuster entered a revenue-sharing agreement with the major studios • Studio charges $8 per copy • Blockbuster pays 30-45% of its rental income • Even if Blockbuster keeps only half of the rental income, the breakeven point is 6 rental per copy • The impact of revenue sharing on Blockbuster was dramatic • Rentals increased by 75% in test markets • Market share increased from 25% to 31% (The 2nd largest retailer, Hollywood Entertainment Corp has 5% market share)
A Multi-Period Inventory Model • Situation • Often, there are multiple reorder opportunities • A central distribution facility which orders from a manufacturer and delivers to retailers • The distributor periodically places orders to replenish its inventory • Reasons why DC holds inventory • Satisfy demand during lead time • Protect against demand uncertainty • Balance fixed costs and holding costs
Continuous Review Inventory Model • Assumptions • Normally distributed random demand • Fixed order cost plus a cost proportional to amount ordered • Inventory cost is charged per item per unit time • If an order arrives and there is no inventory, the order is lost • The distributor has a required service level • expressed as the likelihood that the distributor will not stock out during lead time. • Intuitively, how will the above assumptions effect our policy? • (s, S) Policy • Whenever the inventory position drops below a certain level (s) we order to raise the inventory position to level S
(s, S) Policy • Notations • AVG = average daily demand • STD = standard deviation of daily demand • LT = replenishment lead time in days • h = holding cost of one unit for one day • K = fixed cost • SL = service level (for example, 95%) • The probability of stocking out is 100% - SL (for example, 5%) • Policy • s = reorder point, S = order-up-to level • Inventory Position • Actual inventory + (items already ordered, but not yet delivered)
(s, S) Policy - Analysis • The reorder point (s) has two components: • To account for average demand during lead time:LTAVG • To account for deviations from average (we call this safety stock)zSTDLTwhere z is chosen from statistical tables to ensure that the probability of stock-outs during lead-time is100% - SL. • Since there is a fixed cost, we order more than up to the reorder point:Q=(2KAVG)/h • The total order-up-to level is:S = Q + s
(s, S) Policy - Example • The distributor has historically observed weekly demand of: AVG = 44.6 STD = 32.1 • Replenishment lead time is 2 weeks, and desired service level SL = 97% • Average demand during lead time is: 44.6 2 = 89.2 • Safety Stock is: 1.88 32.1 2 = 85.3 • Reorder point is thus 175, or about 3.9 weeks of supply at warehouse and in the pipeline • Weekly inventory holding cost: .87 • Therefore, Q=679 • Order-up-to level thus equals: • Reorder Point + Q = 176+679 = 855
Periodic Review • Periodic review model • Suppose the distributor places orders every month • What policy should the distributor use? • What about the fixed cost? • Base-Stock Policy
Periodic Review • Base-Stock Policy • Each review echelon, inventory position is raised to the base-stock level. • The base-stock level includes two components: • Average demand during r+L days (the time until the next order arrives):(r+L)*AVG • Safety stock during that time:z*STD* r+L
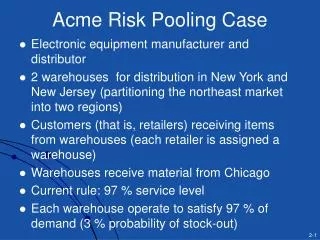
Risk Pooling • Consider these two systems: • For the same service level, which system will require more inventory? Why? • For the same total inventory level, which system will have better service? Why? • What are the factors that affect these answers?
Risk Pooling Example • Compare the two systems: • two products • maintain 97% service level • $60 order cost • $.27 weekly holding cost • $1.05 transportation cost per unit in decentralized system, $1.10 in centralized system • 1 week lead time
Risk Pooling Example • Risk Pooling Performance
Risk Pooling: Important Observations • Centralizing inventory control reduces both safety stock and average inventory level for the same service level. • This works best for • High coefficient of variation, which increases required safety stock. • Negatively correlated demand. Why? • What other kinds of risk pooling will we see?
Inventory in Supply Chain • Centralized Distribution Systems • How much inventory should management keep at each location? • A good strategy: • The retailer raises inventory to level Sr each period • The supplier raises the sum of inventory in the retailer and supplier warehouses and in transit to Ss • If there is not enough inventory in the warehouse to meet all demands from retailers, it is allocated so that the service level at each of the retailers will be equal.
Inventory Management • Best Practice • Periodic inventory reviews • Tight management of usage rates, lead times and safety stock • ABC approach • Reduced safety stock levels • Shift more inventory, or inventory ownership, to suppliers • Quantitative approaches
Forecasting • Recall the three rules • Nevertheless, forecast is critical • General Overview: • Judgment methods • Market research methods • Time Series methods • Causal methods
Judgment Methods • Assemble the opinion of experts • Sales-force composite combines salespeople’s estimates • Panels of experts – internal, external, both • Delphi method • Each member surveyed • Opinions are compiled • Each member is given the opportunity to change his opinion
Market Research Methods • Particularly valuable for developing forecasts of newly introduced products • Market testing • Focus groups assembled. • Responses tested. • Extrapolations to rest of market made. • Market surveys • Data gathered from potential customers • Interviews, phone-surveys, written surveys, etc.
Time Series Methods • Past data is used to estimate future data • Examples include • Moving averages – average of some previous demand points. • Exponential Smoothing – more recent points receive more weight • Methods for data with trends: • Regression analysis – fits line to data • Holt’s method – combines exponential smoothing concepts with the ability to follow a trend • Methods for data with seasonality • Seasonal decomposition methods (seasonal patterns removed) • Winter’s method: advanced approach based on exponential smoothing • Complex methods (not clear that these work better)
Causal Methods • Forecasts are generated based on data other than the data being predicted • Examples include: • Inflation rates • GNP • Unemployment rates • Weather • Sales of other products