Download
1 / 41
410 likes | 441 Views
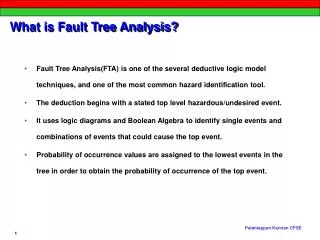
Fault Tree Analysis. Part 7 – Common-Mode Failures. THE COMMON–MODE FAILURES WITHIN FAULT TREES. PUMP 2 (STAND – BY). POWER 2. 2. 3. Independent Power Source. S. SWITCH. POWER 1. 1. PUMP 1 (RUNNING). 10 0. +1. PUMP 2 SPEED. +1. PUMP 2 MECH. FAILURE. 0

E N D
Fault Tree Analysis Part 7 – Common-Mode Failures
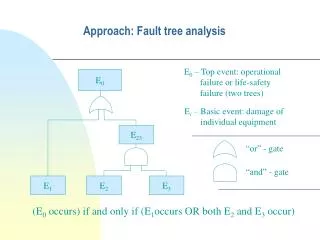
THE COMMON–MODE FAILURES WITHIN FAULT TREES PUMP 2 (STAND – BY) POWER 2 2 3 Independent Power Source S SWITCH POWER 1 1 PUMP 1 (RUNNING)
10 0 +1 PUMP 2 SPEED +1 PUMP 2 MECH. FAILURE 0 +10 0 +1 POWER 2 FAILURE 0 0 -10 S +1 0 -10 (PUMP 1 SPEED = -10) SWITCH STUCK +1 0 -1 -10 POWER 1 FAILURE 0 1 PUMP 1 SPEED PUMP 1 MECH. FAILURE 0 1 -10
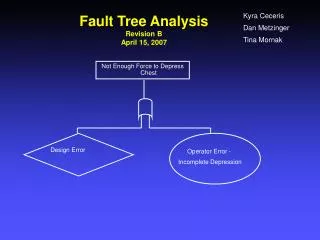
G1 AND Pump 1 Shut Down Pump 2 Not Started OR OR G2 G3 P1 Mech Fail. Local Power 1 Failure P2 Mech Fail. Local Power 2 Faiture Switch Stuck 1 2 3 4 5
THE COMMON–MODE FAILURES WITHIN FAULT TREES PUMP 2 (STAND – BY) POWER 2 2 3 Shared Power Source S SWITCH POWER 1 1 PUMP 1 (RUNNING)
10 0 +1 PUMP 2 SPEED +1 PUMP 2 MECH. FAILURE 0 +10 0 +1 POWER 2 FAILURE 0 0 -10 S +1 0 -10 POWER 1. FAILURE (PUMP 1 SPEED = -10) SWITCH STUCK +1 0 -1 -10 0 POWER 1 FAILURE 0 1 PUMP 1 SPEED PUMP 1 MECH. FAILURE 0 1 -10
G1 AND Pump 1 Shut Down Pump 2 Not Started OR OR G2 G3 P1 Mech Fail. Local Power 1 Failure Local Power 1 Failure P2 Mech Fail. Local Power 2 Faiture Switch Stuck 1 2 3 4 5 2
GATE MIN CUT SETS G2 G3 G1 (1) , (2) (2) , (3) , (4) , (5) (1 , 2) , (1 , 3) , (1 ,4) , (1 ,5) (2 , 2) , (2 , 3) , (2 ,4) , (2 , 5) (1 , 2) , (1 , 3) , (1 , 4) , (1 , 5) (2) , (2 , 3) , (2 , 4) , (2 , 5)
OR 2 AND AND AND 1 5 1 3 1 4 COMP q 1 2 3 4 5 1/3 1/25 1/5 1/35 1/10 4 Hr. 5 Hr. 1 Week 1 Week 3 Months
Cut Set (2) (1 , 3) (1 , 4) (1 , 5) 1 / 25 Yr. 1 / 762 Yr. 1 / 5333 Yr. 1 / 120 Yr. TOP Event Unavailability Importances
DEFINITIONS Common Cause A condition or event which causes multiple basic events in a fault tree. Common-Mode Event The basic events caused by the same common cause are called common–mode events of the cause. Neutral Event For a given common cause, a basic event is called a neutral event if it is independent of the cause. Common–Mode Cut Set A cut set is called common–mode cut set when a common cause results in the co–occurrence of all events in the cut set.
CATEGORIES AND EXAMPLES OF COMMON CAUSES Source Symbol Category Examples Environment, System Components, or Subsystems I Impact Pipe whip, water hammer, missiles, earthquake, structural failure V Vibration Machinery in motion, earthquake P Pressure Explosion, out-of –tolerances system changes (pump overspeed, flow blockage) G Grit Airborne dust, metal fragments generated by moving parts with inadequate tolerances S Stress Thermal stress at welds of dissimilar metals, thermal stresses and bending moments caused by high conductivity and density T Temperature Fire, lightning, welding equipment, cooling system faults, electrical short circuits E Loss of energy Common drive shaft, same power supply source C Calibration Misprinted calibration instruction F Manufacturer Repeated fabrication error, such as neglect to properly coat relay contacts. Poor workmanship. Damage during transportation. IN Installation Same subcontractor or crew Plant Personnel M Maintenance Incorrect procedure, inadequately trained personnel O Operator or operation Operator disabled or overstressed, faulty operating procedures TS Test procedure Faulty test procedures which may affect all component normally tested together Aging A Aging Components of same materials
Top event 2-out-of-3 Gate X 2-out-of-3 Gate Y 2 2 1 2 6 3 4 6 3 12 7 5 10 9 1 4 8 5 2 11
1 1 4 6 4 6 3 12 3 12 2-out-of-3 gate X
6 6 5 10 5 10 9 9 2 11 2 11 2-out-of-3 gate Y
102 104 5 6 3 4 12 106 199 103 10 9 11 101 105 2 7 8 1
Common Causes, Domains, And Common–Mode Events Of Example Category Common Cause Domain Common-Mode Events Impact I1 I2 I3 102, 104 101, 103, 105 106 6, 3 1, 2, 7, 8 10 Stress S1 S2 S3 103, 105, 106 199 101, 102, 104 11, 2, 7, 10 9 1, 4 Temperature T1 T2 106 101, 102, 103, 104, 105, 199 10 5, 11, 8, 12, 3, 4 Vibration V1 V2 102, 104, 106, 101, 103, 105, 199 5, 6, 10 7, 8 Operator O1 O2 AII AII 1, 3, 12 5, 7, 10 Energy source E1 E2 AII AII 2, 9 1, 12 Manufacturer F1 AII 2, 11 Installation Contractor IN1 IN2 IN3 AII AII AII 1, 12 6, 7, 10 3, 4, 5, 8, 9, 11 Test procedure TS1 TS2 AII AII 2, 11 4, 8
SHORT-CUT METHOD FOR OBTAINING COMMON– MODE CUT SETS IN A LARGE FAULT TREE If all the basic events in the ith set are the common-mode events of a common cause, then Otherwise, ( Since multiple events appear in the set )
[EXAMPLE] ( i ) common cause : O1 common-mode events : 1 , 3 , 12 neutral events : 2 , 4 , 5 , 6 , 7 , 8 , 9 , 10 , 11 Gate X : OR AND N AND AND 1 3 12 1 3 12 N OR 3 2 Gate Y : OR OR N NAND AND N OR OR N N N N N
T T AND AND OR OR AND OR AND OR N OR 1 3 12 1 3 1 3 12 N AND 3 1 N N Minimum cut set is { 1 , 3 , 12 } { 1 , 3 , 12 } is the common-mode cut set for the common cause O1. ( ii ) common cause : I3 common – mode events : 10 neutral events : 1 , 2 , ……, 9 , 11 , 12 T X There is no common – mode cut set for I3.
( iii ) In summary Common Cause Common – mode Cut Set I2 I2 S3 S1 T2 O1 { 1 , 2 } { 1 , 7 , 8 } { 1 , 4 } { 2 , 10 , 11 } { 3 , 4 , 12 } { 1 , 3 , 12 }
CHAPTER FOUR Probability Calculation 或然率之計算
RESULTS OF PROBABILITY CALCULATIONS 概率計算之結果 1) The probability of the top event. 2) The “importance” of the cut sets and primal events.
PROBABILITY OF EVENTS CONNECTED BY AN “AND” GATE In general, if events X and Y are probabilistically dependent, then Where, is the probability that X occurs given that Y occurs. If events X and Y are probabilistically independent, then and Usually, it is assumed that the basic events in a fault tree are independent. Thus,
PROBABILITY OF EVENTS CONNECTED BY AN “OR” GATE
PROBABILITY OF EVENTS CONNECTED BY A m OUT OF n VOTING GATE Assume then where
TRANSITION OF COMPONENT STATES Component fails Normal State continues Normal State Failed State Failed State continues Component is repaired
TABLE 4.1 MORTALITY DATA t = age in year; L(t) = number of living at age t t L(t) t L(t) t L(t) t L(t) 0 1 2 3 4 5 10 1,023,102 1,000,000 994,230 990,114 986,767 983,817 971,804 15 20 25 30 35 40 45 962,270 951,483 939,197 924,609 906,554 883,342 852,554 50 55 60 65 70 75 80 810,900 754,191 677,771 577,822 454,548 315,982 181,765 85 90 95 99 78,221 21,577 3,011 125
TABLE 4.2 t Age in Years L(t) Number Living at Age t F(t)=1-R(t) 0 1 2 3 4 5 10 15 20 25 30 35 40 45 50 55 60 65 70 75 80 85 90 95 99 100 1,023,102 1,000,000 994,230 990,114 986,767 983,817 971,804 962,270 951,483 939,197 924,609 906,554 883,342 852,554 810,900 754,191 677,771 577,882 454,548 315,982 181,765 78,221 21,577 3,011 125 0 1. 0.9774 0.9718 0.9678 0.9645 0.9616 0.9499 0.9405 0.9300 0.9180 0.9037 0.8861 0.8634 0.8333 0.7926 0.7372 0.6625 0.5648 0.4443 0.3088 0.1777 0.0765 0.0211 0.0029 0.0001 .0 0. 0.0226 0.0282 0.0322 0.0355 0.0384 0.0501 0.0595 0.0700 0.0820 0.0963 0.1139 0.1366 0.1667 0.2074 0.2628 0.3375 0.4352 0.5557 0.6912 0.8223 0.9235 0.9789 0.9971 0.9999 1.
1.0 P 0.9 Survival distribution 0.8 0.7 0.6 0.5 Probability of Survival R(t) and Death F(t) 0.4 0.3 Failure distribution 0.2 0.1 0 10 20 30 40 50 60 70 80 90 100
TABLE 4.3 FAILURE DENSITY FUNCTION f(t) Age in Years No. of Failures (death) 0 1 2 3 4 5 10 15 20 25 30 35 40 45 50 55 60 65 70 75 80 85 90 95 99 100 23,102 5,770 4,116 3,347 2,950 12,013 9,534 10,787 12,286 14,588 18,055 23,212 30,788 41,654 56,709 76,420 99,889 123,334 138,566 134,217 103,554 56,634 18,566 2,886 125 0 0.02260 0.00564 0.00402 0.00327 0.00288 0.00235 0.00186 0.00211 0.00240 0.00285 0.00353 0.00454 0.00602 0.00814 0.01110 0.01500 0.01950 0.02410 0.02710 0.02620 0.02020 0.01110 0.00363 0.00071 0.00012 0.00540 0.00454 0.00284 0.00330 0.00287 0.00192 0.00198 0.00224 0.00259 0.00364 0.00393 0.00436 0.00637 0.00962 0.01367 0.01800 0.02200 0.02490 0.02460 0.01950 0.00970 0.00210 _- - -
140 120 100 80 Number of Deaths (thousands) 60 40 20 Age in Years (t) 20 40 60 80 100
0.14 0.12 0.10 Failure Density f (t) 0.8 0.6 0.4 0.2 Age in Years (t) 20 40 60 80 100
THE REPAIR - TO - FAILURE PROCESSES Reliability, R(t)* The probability that the component experiences no failure during the time interval (0, t), given that the component was repaired at time zero. Unreliability, F(t)* The probability that the component experiences the first failure during (0, t), given that it is repaired at time zero. Note, R(t) + F(t) = 1. Failure Density, f(t)* The probability that the component experiences a failure per unit time at time t, given that the component was repaired at time zero. Note,
Failure Rate, r(t)* The probability that the component experiences a failure per unit time at time t, given that the component was repaired at time zero and has survival to time t. Mean Time to Failure, MTTF R(t)+F(t) = 1 The component with a constant failure rate, r, is considered as good as new, if it is functioning.
Age in Years No. of Failures (death) Age in Years No. of Failures (death) 0 1 2 3 4 5 10 15 20 25 30 35 23,102 5,770 4,116 3,347 2,950 12,013 9,543 10,787 12,286 14,588 18,055 23,212 0.02260 0.00570 0.00414 0.00338 0.00299 0.00244 0.00196 0.00224 0.00258 0.00311 0.00391 0.00512 40 45 50 55 60 65 70 75 80 85 90 95 99 30,788 41,654 56,709 76,420 99,889 123,334 138,566 134,217 103,554 56,634 18,566 2,886 125 0.00697 0.00977 0.01400 0.02030 0.02950 0.04270 0.06100 0.08500 0.11400 0.14480 0.17200 0.24000 1.20000
Random failures Early failures Wearout failures 0.2 0.15 Failure Rate r(t) 0.1 0.05 20 40 60 80 100 Failure rate r(t) versus t.
THE FAILURE-TO-REPAIR PROCESSES Repair Probability, G(t) F(t) The probability that repair is completed before time t, given that the component failed at time zero. Note, G(t)=0 if the component is non-repairable. Repair Density, g(t) Note, Repair Rate, m(t)* The probability that the components repaired per unit time at time t, given that the component failed at time zero and has been failed to time t. Note, m(t)=0 if the component is non-repairable. M(t)=g(t)/(1-G(t)) Mean Time to Repair, MTTR * A component with a const repair rate has the same chance of being repaired whenever it is failed.
THE WHOLE PROCESS [ EXAMPLE ]
Availability, A(t) : The probability of a component being normal at t. Unavailability, Q(t) : The probability of a component being failed at t. Unconditional Failure Intensity, W(t) : The probability that a component fails per fails per unit time at t. Conditional Failure Intensity, : The proportion of the normal population that is expected to fail per unit time at t. Expected Number of Failures,