Download
1 / 16
160 likes | 304 Views
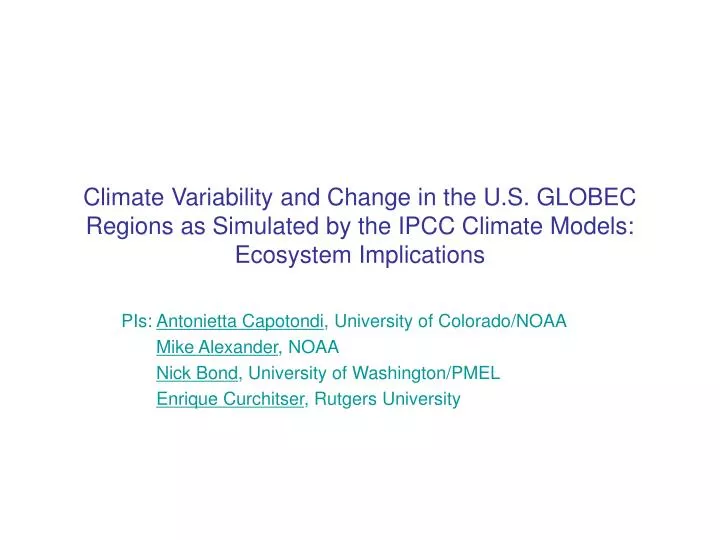
Climate Variability and Change in the U.S. GLOBEC Regions as Simulated by the IPCC Climate Models: Ecosystem Implications. PIs: Antonietta Capotondi , University of Colorado/NOAA Mike Alexander , NOAA Nick Bond , University of Washington/PMEL Enrique Curchitser , Rutgers University.

E N D
Climate Variability and Change in the U.S. GLOBEC Regions as Simulated by the IPCC Climate Models: Ecosystem Implications PIs: Antonietta Capotondi, University of Colorado/NOAA Mike Alexander, NOAA Nick Bond, University of Washington/PMEL Enrique Curchitser, Rutgers University
As stated in the AO (2007): ‘As the culmination of a series of solicitations for the U.S. Global Ocean Ecosystem Dynamics Program (U.S. GLOBEC), this solicitation seeks a broader understanding of climate impacts on marine ecosystems that builds upon findings from the three regional U.S. GLOBEC studies: the Northwest Atlantic, the Northeast Pacific, and the Southern Ocean.’ Observational studies, and studies that use models forced with observations can address the climate-ecosystem interaction over time periods, typically a few decades or less, which may be too short to draw conclusions that are statistically significant. In the presence of climate change it is also important to understand how climate impacts on ecosystems may evolve in the future. Long climate models simulations of present and future climate scenarios can be very useful.
Intergovernmental Panel for Climate Change (IPCC) climate models • Most recent generationof climate models from 23 modeling centers around the world, used in support of the IPCC Assessment Report 4 (AR4). • A set of present day and future climate simulations have been completed by all the models, and the output is archived at PCMDI. • Simulations: • Pre-industrial control simulations • 20th century • Climate change scenarios
IPCC models • Pros in using the models: • Models are global, so that all three GLOBEC regions can be examined • They provide complete information of both oceanic, atmospheric and ice fields (e.g. T, S, U,V are available at each horizontal and vertical grid points), and the fields are consistent with each other, so that physical mechanisms and processes can be examined. • IPCC simulations (control, 20th century, and future climate) are at least 100 yrs long, so that results have statistical confidence. • Cons: • Model resolution is low • Degree of realism is variable
Can coarse resolution models be useful to understand regional processes relevant for the ecosystem? Global climate models can help identify the large-scale patterns of climate variability. Regional processes are often related to the large-scale patterns. Pycnocline depth (h) difference : P2 -P1 P2=1977-1997 P1=1958-1975 NCOM ~2.4 resolution h difference ROMS 19km-13km grid spacing SSH difference ROMS Capotondi et al., JGR, 2009
Proposal questions • Does the present generation of climate models show connections between large-scale low-frequency wind forcing variations and ocean circulation changes in the three GLOBEC areas similar to those we believe exist in nature? Can we use the models to provide larger statistical confidence in those relationships? • Based on the most reliable models, will the influence of climate upon processes in the GLOBEC regions change in the next one to two centuries? • How successful can statistical downscaling be for relating variations at the regional (ecosystem) scale to large-scale climate forcing? Can we identify specific variables that are amenable to statistical downscaling?
Processes (present-day) Northeast Pacific Gulf of Alaska: • Mean upper ocean structure and circulation (use observations and SODA for validation) • Leading modes of SST variability (PDO, “Victoria Mode”/NPGO), and their connection with atmospheric forcing (Ekman pumping), gyre circulation and pycnocline depth variations California Current System (CCS) • Variations in intensity of the North Pacific Current (NPC) and connection with the NPGO • Upwelling index based on alongshore winds or large-scale pressure patterns: Connection with modes of SST variability • Variations in T and S properties along the California Coast, and relationship with upwelling and large-scale gyre variations.
Processes (present-day) Northwest Atlantic: • Variations in Labrador Current (LC), and relationship with basin-scale Ekman pumping, Subpolar gyre circulation strength, and NAO. • Changes in Labrador Sea Water (LSW) formation (from changes in MLD, Holland et al. 2006) • Variations in T and S south of Newfoundland, and relationship with the LC and Gulf Stream transports. • Variations in Arctic outflow.
Processes (present-day) Southern Ocean: • Examine winds, ocean currents, Ekman drift, water properties, ocean heat transport, ice concentration and thickness. • Most important mode of variability is the Southern Annular Mode (SAM) defined as the leading EOF of SLP. ENSO can also be important.Positive SAM is associated with a poleward displacement of the westerlies. Leading EOF of winter SLP north of 9N (a), and south of 9S (b) (from Hall and Visbeck (2002) Positive SAM is associated with poleward displacement of the westerlies, leading to northward Ekman drift south of the mean axis of the winds, and southward drift north of the mean axis, resulting in downwelling at ~45S, and upwelling offshore of Antarctica.
Climate change scenarios B1: CO2 concentration ~550 ppm in 2100 A1B: CO2 concentration ~700 ppm in 2100 A2: CO2 concentration ~820 ppm in 2100 Multi-model means of surface warming forthe 20th century and different climate change scenarios Meehl et al., Bull. Amer. Meteor. Soc., 2007 Diagnostics: Mean conditions + Variability
Downscaling: array of methods used to obtain fine- scale information from a relatively coarse-resolution global climate models. • Develop statistical models based on a ROMS (10km, 60 vertical levels) hindcast (1958-present), and test different techniques for different environments. • Use the latest version of the SODA ocean analysis as an independent test of the statistical models • Apply the statistical relationship to the IPCC output in both present-day and future climate scenarios.
Di Lorenzo et al., GRL, 2008 Modes of climate variability in the North Pacific PDO “Victoria Mode” Bond et al., GRL, 2003
Modes of variability in the North Pacific GFDL_CM21, 500 yrs GFDL_CM20, 500 yrs
Modes of variability in the North Pacific NCAR_CCSM3, 500 yrs UKMO_HadCM3, 340 yrs
Modes of variability in the North Pacific CSIRO, 380 yrs CCCMA, 400 yrs