Download
1 / 19
200 likes | 337 Views
Improving Estimates of Suspended Sediment concentration and flux in the little bear river. Brant Whiting, Jeffery S. Horsburgh and Amber S. Jones Utah Water Research Laboratory Utah State University. Introduction.

E N D
Improving Estimates of Suspended Sediment concentration and flux in the little bear river Brant Whiting, Jeffery S. Horsburgh and Amber S. Jones Utah Water Research Laboratory Utah State University
Introduction • Suspended sediment is cited as the most common impairment to water quality in the U.S. • 51% of stream miles on Utah’s 303(d) list are for sediment related impairments
Introduction • Sediment-related problems cause physical, chemical and biological degradation to water quality including: • Drinking water treatment processes • Recreational uses • Reservoir storage and operation • Fate and transport of heavy metals and other contaminants • Light suppression effects on stream bed vegetation • Ecological function of aquatic habitat, food webs and spawning beds • And more…
Introduction • Traditional monitoring approaches involve infrequent grab samples of TSS and periodic or continuous discharge measurement • Infrequent grab samples do not characterize the temporal variability that we have observed in TSS concentrations • Many are now using turbidity, which can be measured in-situ with high frequency, as a surrogate for TSS
Research Objective • Test the generality of using turbidity as a surrogate for suspended sediment and identify potential confounding factors. • Question 1: How and why do relationships between turbidity and suspended sediment differ from site to site in the Little Bear River watershed? • Question 2: Can point measurements of turbidity from a single sensor be coupled with grab samples of suspended sediment concentrations to create high frequency estimates of suspended sediment concentrations that are representative of the entire stream cross section?
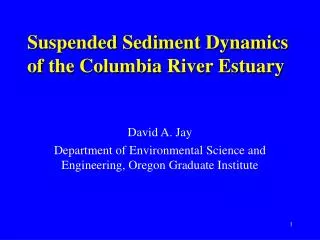
Study Site – Little Bear River Ideal location for this research because: • Existing infrastructure and data (http://littlebearriver.usu.edu) • Strong anthropogenic influence: • Surrounding agricultural land uses • Impoundments (e.g., Hyrum, porcupine reservoirs) • Canal diversions • TMDL - excess nutrient loading and sediment-related impairments
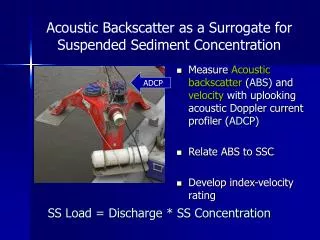
Methods • Instrumentation • Forest Technologies DTS-12 turbidity sensor • Light source: Laser diode (near infrared wavelength) • Range: 0-1600 NTU (temperature corrected) • NTU geometry detects forward and backscatter at 900 to incident beam • Continuous measurement (half hourly) from [Oct 2008- Sept. 2008]
Methods • Suspended Sediment Analysis • Total suspended solids (TSS) - USEPA Method 340.2 and 160.2 • Grab sample at point of in-situ sensor • Stored at 40C • Filtered through 0.45um glass fiber filter • Dried at 103-1050C and weighed solids to constant weight • Existing grab samples • Aug. 2005 - Sept. 2008 • ~80-170 samples
Methods • Regression Analysis • Simple linear regression (SLR) techniques • Ordinary least squares (OLS) • y = b0 + b1X and • y = b0 + b1X + b2Z • Where y is the response or predicted TSS value • b0 , b1 and b2 are parameters estimated by the regression • X is the turbidity value (predictor) and Z is a categorical variable (1 or 0) • Assumptions of SLR • Linearity of the independent and dependent variables • Independence of the error terms • Constant variance in the error terms • Normality of the error term’s distribution
Results 2 1 4 7 6 5
Results – Similar Turbidity • Node 2 • When Turbidity = 161 NTU, TSS = 246 mg/L • Regression equation: • Predicted TSS = -1.72 + 1.92*161 – 22.45*1 = 286 mg/L • Difference of ~15% • Node 5 • Turbidity = 163 NTU, TSS = 657 mg/L • Regression equation: • Predicted TSS = 3.58 + 1.308*163 = 173 mg/L • Difference of ~116% • Predicted TSS difference of 50% between the two sites with the same measured turbidity
Results – Similar TSS • Node 2 • When Turbidity = 24 NTU, TSS = 70 mg/L • Regression equation: • Predicted TSS = -1.72 + 1.92*24 – 22.45*1 = 44.5 mg/L • Difference of ~44% • Node 5 • Turbidity = 38 NTU, TSS = 70 mg/L • Regression equation: • Predicted TSS = 3.58 + 1.308*38 = 43 mg/L • Difference of ~48% • Measured turbidity difference of 45% between the two sites with the same measured TSS
What’s next? • These cases illustrate the site specific nature of turbidity as a surrogate for TSS in the little bear river • Differences shown in the regression equations (slope, intercept and range of range of applicable values) • Sources of variability in sediment flux estimates • Turbidity instrument • TSS analysis • Regression equations • Stage discharge relationship • Turbidity response is affected by particle characteristics such as: • Size, shape, density (organic, mineral content) and water color • Point vs. cross-section averaged measurements of turbidity and TSS
Continued Research • Research Question 1 • Particle size analysis • Sequoia Scientific LISST-Portable Particle Analyzer • Particle size determined by Laser Diffraction techniques (AWWA Std. No. 2560D) • 1.9 – 381 micron size range • Organic content analysis at 4 sites • Organic matter determined with Teledyne TOC Analyzer • Combustion-Infrared Method 5310 B TOC Analyzer LISST-Portable
Continued Research • Research Question 2 • Point vs. Cross section measurements • Cross section at existing sensor location • Sample at range of hydrological conditions • Vertically integrated turbidity and TSS samples taken across the width of the channel • Develop a correction factor for conditions when they are different DH-48 Sediment Sampler Width V1 V2 V3 V4 V5 V6 V7 V8 Depth Turbidity TSS