Download
1 / 16
160 likes | 282 Views
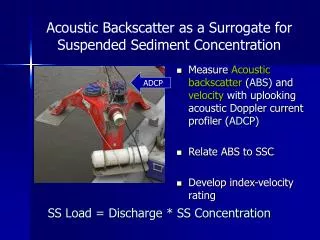
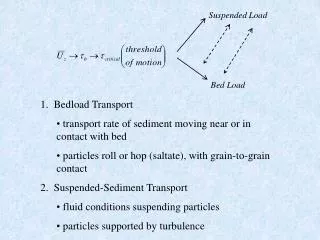
Item # 2b. Zone 4 Line A Preliminary Suspended Sediment Load Estimates HY08. Rand Eads RiverMetrics LLC www.rivermetrics.com rivermetrics@gmail.com 503-435-7516 Sources Pathways and Loadings Workgroup December 8, 2008. HY07 11/10/06 – 4/30/07 Rainfall 10.38 in. 21 storms Max Q 308 cfs

E N D
Item # 2b Zone 4 Line APreliminary Suspended Sediment Load Estimates HY08 Rand Eads RiverMetrics LLC www.rivermetrics.com rivermetrics@gmail.com 503-435-7516 Sources Pathways and Loadings Workgroup December 8, 2008
HY07 11/10/06 – 4/30/07 Rainfall 10.38 in. 21 storms Max Q 308 cfs Total Q 33,400 cfs 84 SSC analyzed Max SSC 2,744 mg/L Max turbidity 1590 TU Est. load 139.6 MT HY08 1/31/08 – 6/11/08 Rainfall 2.11 in. 18 storms Max Q 241 cfs Total Q 22,900 cfs 66 SSC analyzed Max SSC 2,095 mg/L Max turbidity 892 TU Est. load 94.7MT Item # 2b Zone 4 Line A
Item # 2b Changes in Data Collection Methods from HY07 to HY08 • Bed-mounted boom provided complete data record for season • Turbidity sensor and sampler intake at depth-proportional sampling position • Improved debris shedding • Possible increase in sand to fine ratio
Item # 2b r2 = 0.90 r2 = 0.89 r2 = 0.89 r2 = 0.89
Item # 2b 0.14”
Item # 2b 0.12”
Item # 2b 0.38”
Item # 2b 0.12”
Item # 2b Storms account for ~95% of the seasonal load
9 rising turbidity thresholds (50 - 970) 6 falling turbidity thresholds (925 – 100) Early season contaminate rising thresholds: 105, 319, 670, 970 Mid season contaminate rising thresholds: 72, 220, 462, 670 Item # 2b Zone 4 Sampling HY09