Download
1 / 12
120 likes | 400 Views
ADCP Measurement of Suspended Sediment in the Tidal Hudson River. Elizabeth Nystrom Gary Wall New York District. Hudson River Basin. $89 billion of cargo went through the port of NY/NJ in 2002 River is tidal 153 miles to Federal Dam at Troy

E N D
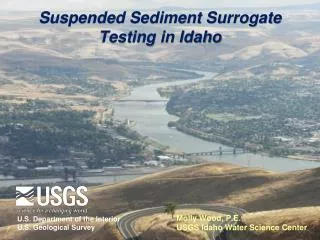
ADCP Measurement of Suspended Sediment in the Tidal Hudson River Elizabeth Nystrom Gary Wall New York District
Hudson River Basin • $89 billion of cargo went through the port of NY/NJ in 2002 • River is tidal 153 miles to Federal Dam at Troy • Can’t use conventional methods to measure suspended sediment load
Acoustic Backscatter as a Surrogate for Suspended Sediment • Relate the signal echo strength to concentration of suspended sediment Signal Signal Echo Echo
Uplooking ADCP • 600 kHz Sentinel • 1 ensemble every 15 min • Transmit data over acoustic modem • ~ 60 ft deep ADCP Acoustic Modem
Load Computations Suspended Sediment Load = SSC * Q • Suspended Sediment Ratings • Acoustic Backscatter ® Concentration • Uplooker ABS ® Cross Section ABS • Discharge Rating • Uplooker Velocity & Wind Stress ® Discharge
Backscatter-Concentration Rating • Typical tidal range of ABS: ~15 dB • Observed range of ABS: 65 – 100 dB • Typical concentration: 25-100 mg/L • Max concentration: ~200 mg/L SSC = 10 (0.035 * ABS – 0.01 * Temp – 1.21) * 1.055
Discharge Rating • Typical tidal range ± 300,000 cfs • Peak flows: -345,000 & 380,000 • Max net flow: ~125,000 Q = 130,883 * Vel + 443.7 * Wind Stress – 14,244
Data Transfer (not to scale)
Data Processing Raw Data WinRiver ASCII Excel ADAPS Atmospheric data
Near Real Time Data • Velocity, backscatter and discharge data • Updated daily
Questions? For more information: Poster session later today Project web page: http://ny.water.usgs.gov/projects/poused/