Download
1 / 12
120 likes | 182 Views
Part 4 Attribute charts Control Chart. Using Minitab to construct Attribute charts Control Chart. الأنواع المختلفة من المخططات السمه (attribute control) هي أثنان

E N D
Using Minitab to construct Attribute charts Control Chart الأنواع المختلفة من المخططات السمه (attribute control) هي أثنان الفئة الأولىي: تشمل مراقبة الخرائط التي تركز على نسبة الأصناف غير المطابقة (P-chart) و الخرائط التي تركز علي عدد الأصناف الغير مطابقة (NP-chart) الفئة الثانية: تشمل ايضا مخططين يرتكزان على عدم المطابقة نفسها فالنوع الاول مخطط العدد الإجمالي من عدم المطابقة (C-chart). أما المخطط الثاني هو مخطط عدم المطابقة لكل وحدة (U-chart) ينطبق على الحالات التي يختلف حجم وحدة العينة من عينة الي أخري.
Attribute Control Chart Attribute control charts are the charts that plot nonconformities (defects) or nonconforming units (defectives). A nonconformity refers to a quality characteristic and a nonconforming unit refers to the overall product. A unit may have many nonconformities, but the unit itself is either conforming or nonconforming. For example, a scratch on a metal panel is a nonconformity. If several scratches exist, the entire panel may be considered nonconforming. In fact, control charts for attributes are used to measure quality characteristics that are counted rather than measured. Attributes are discrete in nature and entailتستتبع simple yes-or-no decisions. For example, this could be the number of nonfunctioning lightbulbs, the proportion of broken eggs in a carton, the number of rotten فاسد apples, the number of scratches on a tile قرميد, or the number of complaints issued.
Types of control charts for attributes Two of the most common types of control charts for attributes are p-charts and c-charts. P-charts are used to measure the proportion of items in a sample that are defective. Examples are the proportion of broken cookies(nonconformity)in a batch and the proportion of cars produced with a misaligned fender اكصدامات منحرفه. P-charts are appropriate when both the number of defectives measured and the size of the total sample can be counted. A proportion can then be computed and used as the statistic of measurement. C-chartscount the actual number of defects. For example, we can count the number of complaints from customers in a month, the number of bacteria on a petri dishطبق المخبر, or the number of barnacles الحشف on the bottom of a boat. However, we cannot compute the proportion of complaints from customers, the proportion of bacteria on a petri dish, or the proportion of barnacles on the bottom of a boat. The primary difference between using a p-chart and a c-chart is as follows. A p-chartis used when both the total sample size and the number of defects can be computed. A c-chartis used when we can compute only the number of defects but cannot compute the proportion that is defective.
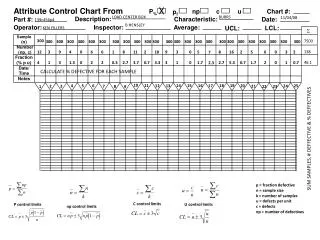
P-charts are used to measure the proportion that is defective in a sample. The computation of the center line as well as the upper and lower control limits is similar to the computation for the other kinds of control charts. The center line is computed as the average proportion defective in the population, . This is obtained by taking a number of samples of observations at random and computing the average value of p across all samples. To construct the upper and lower control limits for a p-chart, we use the following formulas: where z standard normal variable the sample proportion defective the standard deviation of the average proportion defective The sample standard deviation is computed as follows: where nis the sample size.
Example: A production manager at a tire manufacturing plant has inspected the number of defective tires in twenty random samples with twenty observations each. Following are the number of defective tires found in each sample: sample 20 20 20 20 20 20 20 20 20 20 20 20 20 20 20 20 20 20 20 20 No. defects 1 3 2 2 3 1 42 5 1 6 3 7 3 8 2 9 1 10 2 11 3 12 2 13 2 14 1 15 1 16 2 17 4 18 3 19 1 20 1 Construct a three-sigma control chart (z =3) with this information
The center line of the chart is In this example the lower control limit is negative, which sometimes occurs because the computation is an approximation of the binomial distribution. When this occurs, the LCL is rounded up to zero because we cannot have a negative control limit.
The npControl Chart. It is also possible to base a control chart on the number nonconforming rather than the fraction nonconforming. This is often called an number nonconforming (np) control chart. The parameters of this chart are as follows.
C-charts are used to monitor the number of defects per unit. Examples are the number of returned meals in a restaurant, the number of trucks that exceed their weight limit in a month, the number of discolorations on a square meters of carpet, and the number of bacteria in a milliliter of water. Note that the types of units of measurement we are considering are a period of time, a surface area, or a volume of liquid. The average number of defects, is the center line of the control chart. The upper and lower control limits are computed as follows:
Example: The number of weekly customer complaints are monitored at a large hotel using a c-chart. Complaints have been recorded over the past twenty weeks. Develop three-sigma control limits using thefollowing data: week No. of comp 1 3 2 2 3 3 4 1 5 3 6 3 7 2 8 1 9 3 10 1 11 3 12 4 13 2 14 1 15 1 16 1 17 3 18 2 19 2 20 3 Solution The average number of complaints per week is 44/20=2.2 Therefore: As in the previous example, the LCL is negative and should be rounded up to zero. Following is the control chart for this example:
U-chart There is no reason why the sample size must be restricted to one inspection unit. In fact, we would often prefer to use several inspection units in the sample, thereby increasing the area of opportunity for the occurrence of nonconformities. The sample size should be chosen according to statistical considerations, such as specifying a sample size large enough to ensure a positive lower control limit or to obtain a particular probability of detecting a process shift. Alternatively, economic factors could enter into sample-size determination. The average number of nonconformities per unit («), which is also the centerline of a U-chart, is given by: The control limits are given by
Example: The given data represent number of defect found in toys in daily inspection, draw the U control chart control day defect sample 1 9 110 1 11 101 1 2 98 1 5 105 2 15 110 2 13 100 2 8 98 2 7 99 3 5 100 3 2 100 3 4 102 3 4 98 4 2 99 4 5 105 4 5 104 4 2 100 5 3 103 5 2 100 5 1 98 5 6 102 Solution Minitab software