Download
1 / 1
10 likes | 65 Views
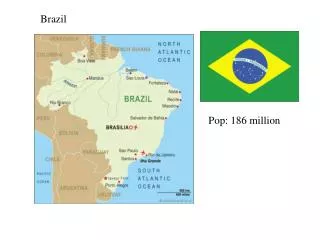
Lat=-23.6 o Lon=- 46.7 o. Vehicles: > 7 million.

E N D
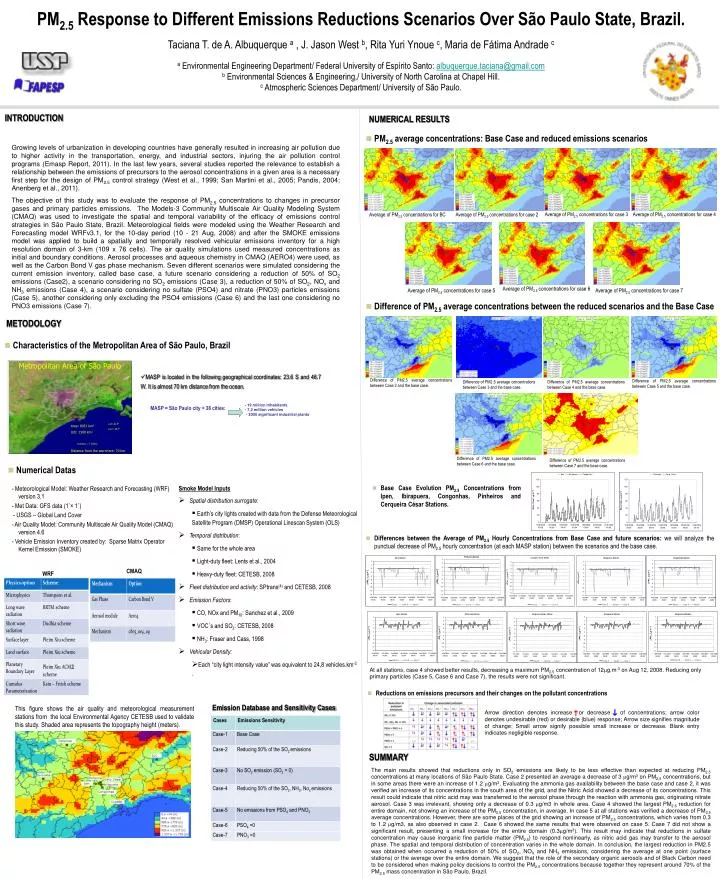
Lat=-23.6o Lon=- 46.7o Vehicles: > 7 million Arrow direction denotes increase or decrease of concentrations; arrow color denotes undesirable (red) or desirable (blue) response; Arrow size signifies magnitude of change; Small arrow signify possible small increase or decrease. Blank entry indicates negligible response. PM2.5 Response to Different Emissions Reductions Scenarios Over São Paulo State, Brazil. Taciana T. de A. Albuquerque a , J. Jason West b, Rita Yuri Ynoue c, Maria de Fátima Andrade c a Environmental Engineering Department/ Federal University of Espírito Santo: albuquerque.taciana@gmail.com b Environmental Sciences & Engineering,/ University of North Carolina at Chapel Hill. c Atmospheric Sciences Department/ University of São Paulo. INTRODUCTION NUMERICAL RESULTS • PM2.5 average concentrations: Base Case and reduced emissions scenarios Growing levels of urbanization in developing countries have generally resulted in increasing air pollution due to higher activity in the transportation, energy, and industrial sectors, injuring the air pollution control programs (Emasp Report, 2011). In the last few years, several studies reported the relevance to establish a relationship between the emissions of precursors to the aerosol concentrations in a given area is a necessary first step for the design of PM2.5 control strategy (West et al., 1999; San Martini et al., 2005; Pandis, 2004; Anenberg et al., 2011). The objective of this study was to evaluate the response of PM2.5 concentrations to changes in precursor gases and primary particles emissions. The Models-3 Community Multiscale Air Quality Modeling System (CMAQ) was used to investigate the spatial and temporal variability of the efficacy of emissions control strategies in São Paulo State, Brazil. Meteorological fields were modeled using the Weather Research and Forecasting model WRFv3.1, for the 10-day period (10 - 21 Aug, 2008) and after the SMOKE emissions model was applied to build a spatially and temporally resolved vehicular emissions inventory for a high resolution domain of 3-km (109 x 76 cells). The air quality simulations used measured concentrations as initial and boundary conditions. Aerosol processes and aqueous chemistry in CMAQ (AERO4) were used, as well as the Carbon Bond V gas phase mechanism. Seven different scenarios were simulated considering the current emission inventory, called base case, a future scenario considering a reduction of 50% of SO2 emissions (Case2), a scenario considering no SO2 emissions (Case 3), a reduction of 50% of SO2, NOx and NH3 emissions (Case 4), a scenario considering no sulfate (PSO4) and nitrate (PNO3) particles emissions (Case 5), another considering only excluding the PSO4 emissions (Case 6) and the last one considering no PNO3 emissions (Case 7). Average of PM2.5 concentrations for case 3 Average of PM2.5 concentrations for case 4 Average of PM2.5 concentrations for BC Average of PM2.5 concentrations for case 2 Average of PM2.5 concentrations for case 6 Average of PM2.5 concentrations for case 5 Average of PM2.5 concentrations for case 7 • Difference of PM2.5 average concentrations between the reduced scenarios and the Base Case METODOLOGY • Characteristics of the Metropolitan Area of São Paulo, Brazil • MASP is located in the following geographical coordinates: 23.6 S and 46.7 W. It is almost 70 km distance from the ocean. Difference of PM2.5 average concentrations between Case 2 and the base case. Difference of PM2.5 average concentrations between Case 5 and the base case. Difference of PM2.5 average concentrations between Case 3 and the base case. Difference of PM2.5 average concentrations between Case 4 and the base case. WRF CMAQ MASP = São Paulo city + 38 cities: - 19 million inhabitants - 7,2 million vehicles - 2000 significant industrial plants Difference of PM2.5 average concentrations between Case 6 and the base case. Difference of PM2.5 average concentrations between Case 7 and the base case. • Numerical Datas - Meteorological Model: Weather Research and Forecasting (WRF) version 3.1 - Met Data: GFS data (1˚× 1˚) - USGS – Global Land Cover - Air Quality Model: Community Multiscale Air Quality Model (CMAQ) version 4.6 - Vehicle Emission Inventory created by: Sparse Matrix Operator Kernel Emission (SMOKE) • Smoke Model Inputs • Spatial distribution surrogate: • Earth’s city lights created with data from the Defense Meteorological Satellite Program (DMSP) Operational Linescan System (OLS) • Temporal distribution: • Same for the whole area • Light-duty fleet: Lents et al., 2004 • Heavy-duty fleet: CETESB, 2008 • Fleet distribution and activity: SPtrans(4) and CETESB, 2008 • Emission Factors: • CO, NOx and PM10: Sanchez et al., 2009 • VOC´s and SO2: CETESB, 2008 • NH3: Fraser and Cass, 1998 • Vehicular Density: • Each “city light intensity value” was equivalent to 24,8 vehicles.km-2 . • Base Case Evolution PM2.5 Concentrations from Ipen, Ibirapuera, Congonhas, Pinheiros and Cerqueira César Stations. • Differences between the Average of PM2.5 Hourly Concentrations from Base Case and future scenarios: we will analyze the punctual decrease of PM2.5 hourly concentration (at each MASP station) between the scenarios and the base case. At all stations, case 4 showed better results, decreasing a maximum PM2.5 concentration of 12mg.m-3 on Aug 12, 2008. Reducing only primary particles (Case 5, Case 6 and Case 7), the results were not significant. • Reductions on emissions precursors and their changes on the pollutant concentrations Emission Database and Sensitivity Cases This figure shows the air quality and meteorological measurement stations from the local Environmental Agency CETESB used to validate this study. Shaded area represents the topography height (meters). SUMMARY The main results showed that reductions only in SO2 emissions are likely to be less effective than expected at reducing PM2.5 concentrations at many locations of São Paulo State. Case 2 presented an average a decrease of 3 g/m3 on PM2.5 concentrations, but in some areas there were an increase of 1.2 g/m3. Evaluating the ammonia gas availability between the base case and case 2, it was verified an increase of its concentrations in the south area of the grid, and the Nitric Acid showed a decrease of its concentrations. This result could indicate that nitric acid may was transferred to the aerosol phase through the reaction with ammonia gas, originating nitrate aerosol. Case 3 was irrelevant, showing only a decrease of 0.3 g/m3 in whole area. Case 4 showed the largest PM2.5 reduction for entire domain, not showing an increase of the PM2.5 concentration, in average. In case 5 at all stations was verified a decrease of PM2.5 average concentrations. However, there are some places of the grid showing an increase of PM2.5 concentrations, which varies from 0.3 to 1.2 g/m3, as also observed in case 2. Case 6 showed the same results that were observed on case 5. Case 7 did not show a significant result, presenting a small increase for the entire domain (0.3mg/m3). This result may indicate that reductions in sulfate concentration may cause inorganic fine particle matter (PM2.5) to respond nonlinearly, as nitric acid gas may transfer to the aerosol phase. The spatial and temporal distribution of concentration varies in the whole domain. In conclusion, the largest reduction in PM2.5 was obtained when occurred a reduction of 50% of SO2, NOX and NH3 emissions, considering the average at one point (surface stations) or the average over the entire domain. We suggest that the role of the secondary organic aerosols and of Black Carbon need to be considered when making policy decisions to control the PM2.5 concentrations because together they represent around 70% of the PM2.5 mass concentration in São Paulo, Brazil.