Download
1 / 17
170 likes | 361 Views
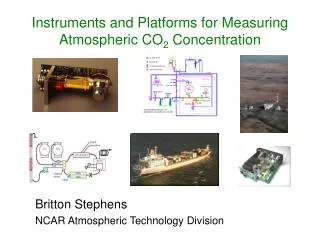
CO 2 and O 2 Concentration Measurements. Global carbon cycle Regional scale CO 2 measurements Potential biases in NDIR CO 2 measurements Results from the WLEF O 2 measurement program Hands on: Calculating ppm from volts using different techniques. Britton Stephens, NCAR/ATD

E N D
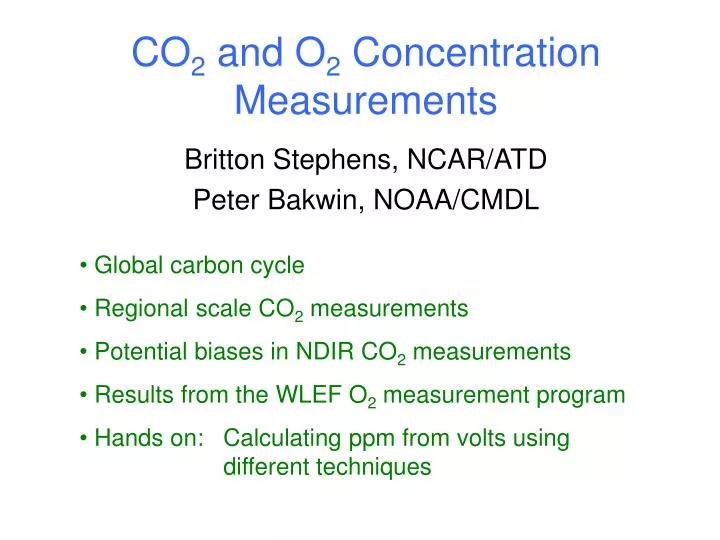
CO2 and O2 Concentration Measurements • Global carbon cycle • Regional scale CO2 measurements • Potential biases in NDIR CO2 measurements • Results from the WLEF O2 measurement program • Hands on: Calculating ppm from volts using different techniques Britton Stephens, NCAR/ATD Peter Bakwin, NOAA/CMDL
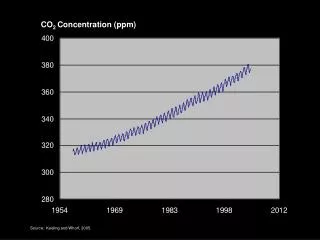
Atmosphere Ocean 760 + 3/yr 38,000 The Global Carbon Cycle “Sinks” for anthropogenic CO2 are very small relative to natural fluxes We need to understand current sinks to predict future CO2 and climate ~120 ~90 ~120 ~90 8 GtC/yr Land Humans 2000
Expected from fossil fuel emissions What do existing flask measurements tell us? TransCom1 FF Gradients Observations
TEMPERATURE (C) (IPCC, 2001) (NRCS/USDA, 1997) Regional scale is critical for linking to underlying processes (NRCS/USDA, 1997) CHLOROPHYLL (SeaWIFS, 2002)
TURC/NDVI Biosphere, Takahashi Ocean, EDGAR Fossil Fuel (Ute Karstens and Martin Heimann, 2001)
Using high frequency data makes signals bigger, but the annual-mean signals are still very small: Flux footprint, in ppm(GtCyr-1)-1, for a 106 km2 chaparral region in the U.S. Southwest (Gloor et al., 1999).
Assessing horizontal CO2 transport at eddy-flux sites similarly requires networks of independent, accurate CO2 measurements
Takehome Points • Strong needs exist for measuring regional and local scale continental CO2 gradients • Measuring CO2 gradients with independent instruments requires careful attention to potential biases • New models are also needed to extract information from continental CO2 measurements
CO2 and O2 Concentration Measurements • Global carbon cycle • Regional scale CO2 measurements • Potential biases in NDIR CO2 measurements • Results from the WLEF O2 measurement program • Hands on: Calculating ppm from volts using different techniques Britton Stephens, NCAR/ATD Peter Bakwin, NOAA/CMDL
Using high frequency data makes signals bigger, but the annual-mean signals are still very small: To measure 0.2 GtCyr-1 source or sink to +/- 25% need to measure annual mean gradients to around +/- 0.2 ppm Flux footprint, in ppm(GtCyr-1)-1, for a 106 km2 chaparral region in the U.S. Southwest (Gloor et al., 1999).
Intra- and Inter-laboratory agreement still not better than 0.2 ppm
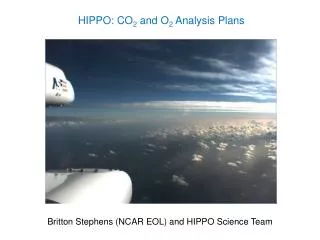
Atmospheric Observing Systems Boulder, Colorado NOAA SBIR Robust, Precise, CO2 Analyzer for Unattended Field Use Under Development • 1 part in 3000 in 1 minute or less • 30 cc/min or less gas usage • Unattended field deployment for 6 months or more • $5,000 or less when manufactured in quantity
Prototype Inexpensive/Autonomous CO2 System RMT, Ltd., Russia • Research items: • Stability of CO2 in aluminum LPG cylinders • Correction for zero drift between calibrations • Goals: • 1-2 year service schedule • Total installation ~ $2000 • 0.5 ppm accuracy


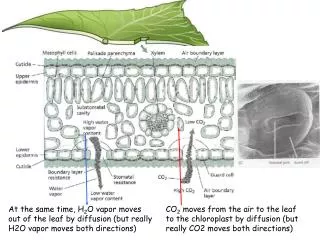
![[SO 2 + H 2 O H 2 SO 3 ] SO 3 + H 2 O H 2 SO 4 CO 2 +H 2 O H 2 CO 3](https://cdn2.slideserve.com/4275035/slide1-dt.jpg)