Download
1 / 30
300 likes | 411 Views
Britton Stephens NCAR Atmospheric Technology Division. Instruments and Platforms for Measuring Atmospheric CO 2 Concentration. Outline. Measurement technologies Instruments Precision, potential bias, costs, CDAS implementation Platforms Costs, CDAS implementation.

E N D
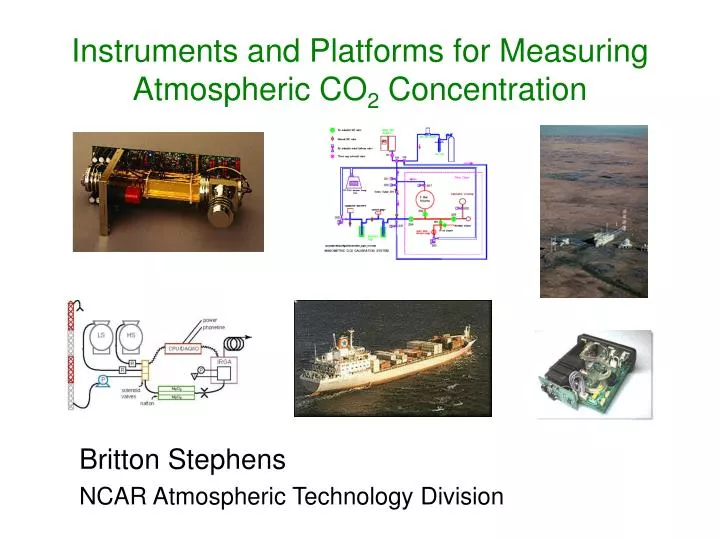
Britton Stephens NCAR Atmospheric Technology Division Instruments and Platforms for Measuring Atmospheric CO2 Concentration
Outline • Measurement technologies • Instruments • Precision, potential bias, costs, CDAS implementation • Platforms • Costs, CDAS implementation Accuracy, or more formally reproducibility, is determined by calibration procedures Measurement expenses are largely a function of the cost of the people who carry them out.
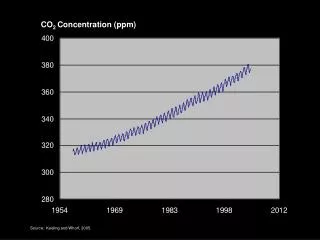
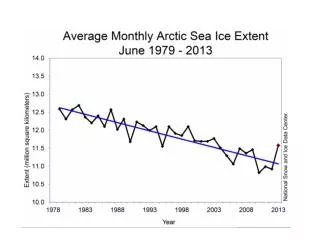
Expected from fossil fuel emissions What do existing flask measurements tell us? TransCom1 FF Gradients Observations
Dry Mole Fraction of CO2 For ± 0.1 ppm consistency, need to stabilize to ± 300 ppm H2O (or dry to dewpoint of -25 ºC)
Absolute Measurement Techniques: Manometric and Gravimetric NOAA/CMDL Manometer: Reproducibility of 0.06 ppm (C. Zhao et al., 1997)
Relative Measurement Techniques: Non-dispersive Infrared (NDIR) Spectroscopy • Broadband IR radiation filtered for 4.26 um • Cooled emitter and detector • Pulsed emitter or chopper wheel • 1 or 2 detection cells (from www.tsi.com) Advantages: Robust, precise Disadvantages: Non-linear; sensitivity to pressure, temperature, and optical conditions; pressure broadening; power consumption
NDIR measurements require calibration gases tied to a common scale NOAA/CMDL scheme for propagation of WMO CO2 scale: At least 4 points needed for 0.1 ppm consistency Recalibration needed ~ every 3 years due to drift $2000
LiCor, Inc. CO2 Analyzer CMDL Flask Analysis System
Typical LiCor Output Signals (from www.cmdl.noaa.gov/ccgg)
Intra- and Inter-laboratory agreement still not better than 0.2 ppm
LiCor Analyzer Specifications CDAS v 1.0 Implementation
Manual Flask Sampling CDAS v 1.0 Implementation 1Selective sampling based on radon in v 2.0
Automated Flask Sampling (from www.cmdl.noaa.gov/ccgg) CDAS v 1.0 Implementation
Atmospheric Observing Systems Boulder, Colorado NOAA SBIR Robust, Precise, CO2 Analyzer for Unattended Field Use Under Development • 1 part in 3000 in 1 minute or less • 30 cc/min or less gas usage • Unattended field deployment for 6 months or more • $5,000 or less when manufactured in quantity
NOAA/AOS Analyzer Specifications CDAS v 1.0 Implementation
Niwot Ridge Pilot Study August 2002 Jeilun Sun, Steve Oncley, Alex Guenther, Dave Schimel, Don Lenschow, Britt Stephens, Russ Monson, and others.
Prototype Inexpensive/Autonomous CO2 System RMT, Ltd., Russia • Research items: • Stability of CO2 in aluminum LPG cylinders • Correction for zero drift between calibrations • Goals: • 1-2 year service schedule • Total installation ~ $2000 • 0.5 ppm accuracy
NCAR/RMT Analyzer Specifications CDAS v 1.0 Implementation
Remote Sensing Instruments(not implemented in CDAS v 1.0) • Upward-looking Fourier-transform infrared (FTIR) spectrometers (~$300K+) • Active and passive satellite CO2 measurements ($200- $300M) • Both ~ 1-3 ppm in column average with potential biases due to land cover type, aerosols, clouds, viewing and sun angle • Virtual tall towers (~$50K), 0.2-1.0 ppm for weekly-monthly mid-boundary layer values
Ground Station Point Barrow Alaska CDAS Implementation
Very Tall Tower WLEF, Wisconsin, USA CDAS Implementation
Light Aircraft Profile Carr, Colorado, USA CDAS Implementation (from www.cmdl.noaa.gov/ccgg)
Volunteer Observing Ship Blue Star Line CDAS Implementation Freighter Travel, Ltd.
Buoy ATLAS Buoy, TAO Array CDAS Implementation (from NOAA/PMEL)
Additional Platforms(not implemented in CDAS v 1.0) • Research Aircraft ($1,500-$20,000 per hour) • Research Ships (~$20,000 per day)
Conclusions • There are wide ranges of available instruments and platforms for CO2 concentration measurements • All have different setup and operation costs, precisions, and potential biases • Complexity requires a tool for quantitatively assessing creatively designed networks