Download
1 / 32
320 likes | 325 Views
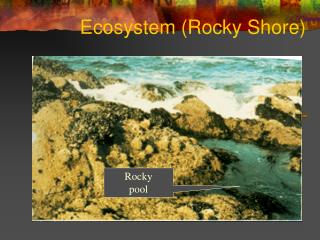
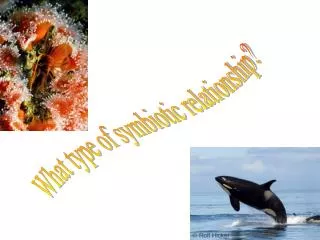
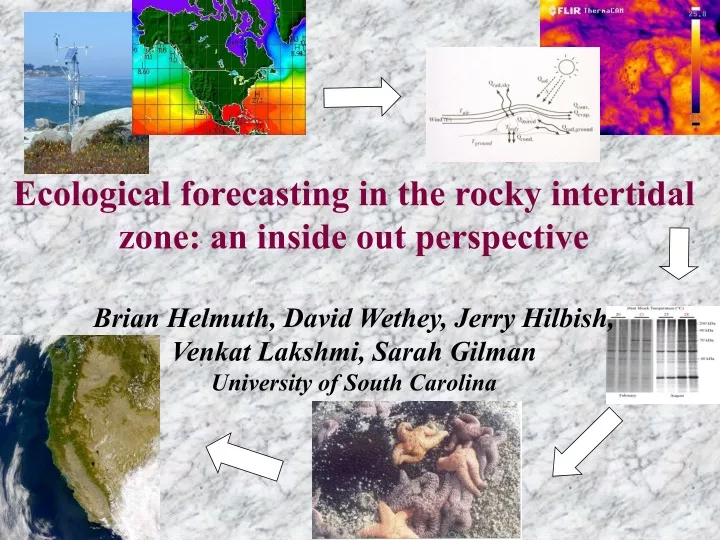
Ecological forecasting in the rocky intertidal zone: an inside out perspective Brian Helmuth, David Wethey, Jerry Hilbish, Venkat Lakshmi, Sarah Gilman University of South Carolina. Intertidal zone has long served as a model for how climate affects species distribution patterns. Chthamalus

E N D
Ecological forecasting in the rocky intertidal zone: an inside out perspectiveBrian Helmuth, David Wethey, Jerry Hilbish, Venkat Lakshmi, Sarah GilmanUniversity of South Carolina
Intertidal zone has long served as a model for how climate affects species distribution patterns Chthamalus (barnacle) Balanus (barnacle) Mytilus (mussel) Increasing Abiotic Stress
Are intertidal ecosystems “early warning systems” for the effects of climate change? • Rocky intertidal algae and invertebrates are assumed to live very close to their thermal tolerance limits • New biochemical and molecular techniques show that significant thermal damage can occur during exposure to temperatures experienced during low tide • Evidence of responses of species distributions to temperature changes
However…. • Thermal damage often occurs after exposure to temperatures experienced during low tide, when body temperature is driven by terrestrialclimate • Body temperature during low tide is driven by multiple climatic factors, and can be different from skin (surface), air or water temperature • What are patterns of intertidal temperature in nature? • Where and when do we look for the effects of climate change on intertidal communities? • How do we link studies conducted under controlled laboratory conditions with those in the field (what are patterns of intertidal organism temperature in nature?)
Change in heat stored = Heat in - Heat out Qrad, sky Qsolar Qconvection Qevaporation Wind Qrad, ground Qconduction Tair Qstored m, cp Tbody Twater Tground
Heat flux is determined largely by thecharacteristics of the organism: m cpd(Tb/dt) = Heat in - Heat out =Cblah Ablah(Tblah - Tb) where: m = mass [ f (size, materials)] cp = specific heat [ f (materials)] Cblah=coefficient [ f (size, morphology)] Ablah = area of transfer [ f (size, morphology)] (Tblah - Tb) = temperature gradient
Two organisms exposed to identical microclimates can experience very different body temperatures Seastar at ~12°C Mussel at ~21°C Helmuth 2002. Integrative and Comparative Biology 42: 837-845.
Instrument characteristics determine the temperatures that they record Unmatched loggers regularly create errors of >14°C* Thermally matched loggers incur errors of ~2°C “Robomussel” California mussel, Mytilus californianus *Fitzhenry et al. 2004 Marine Biology 145: 339-349.
Thermal mosaic over a large geographic range Shady Cove Cattle Point Tatoosh Boiler Bay Strawberry Hill Monterey Piedras Blancas Cambria Lompoc Landing Jalama Alegria Boat House Coal Oil Pt (Helmuth et al. 2002 Science 298:1015-1017)
In part this pattern is due to variability in the timing of low tides in summer….. (Helmuth et al. 2002 Science 298:1015-1017)
Patterns of thermal stress in M. californianus • Geographic patterns of stress based on actual measurements of intertidal body temperature show us a fundamentally different pattern - and make very different predictions of where “trouble spots” may emerge - than do predictions based only on environmental variables such as air or water temperature
Patterns of thermal stress in M. californianus • Temperatures are not always hotter at equatorial (southern) sites, mainly due to the timing of low tide in summer (mid-day in North) • Suggests presence of “hot spots” (e.g. central Oregon, Puget Sound) where summertime low tides coincide with periods of low wave splash and hot climatic conditions • Climate change may not cause simple range shifts, but instead may “punch holes” in distributions, if they exceed larval dispersal distances
Poleward Shift? Disjunct Distributions?
Heat budget model Qrad,sky Qsolar Tair Qevap. Qconv Qstored Wind Tb Twater Qrad, ground Tground NASA R/S climate data NOAA Weather and wave data Our weather stations Qcond Verify using ground-based msmts Generate thermal maps of risk *Helmuth, Wethey, Hilbish, Lakshmi, Woodin, and Power labs
Multiple Working Hypotheses Based on Physiological Stress • Lethal thermal stress during aerial exposure at low tide (high or low) • Sublethal thermal stress during aerial exposure (high or low) • Failure to reproduce due to elevated water temperature • Salinity or sediment stress
Microclimate Model Predict rock/animal temperature from • air temperature, humidity, wind, cloud cover • NOAA ground & buoy observations • NERR (US National Estuarine Research Reserve) SWMP • Satellite observations • water temperature • NOAA tide station, CMAN & buoy observations • NERR SWMP • Satellite observations • Tides • NOAA model /observations or WxTide • Wave height adjustment (NOAA buoy observations) • NERR SWMP • http://tbone.geol.sc.edu/tide • OSU Topex/Poseidon Inverse Solution (TPXO) • Solar radiation: • angle of incidence of direct sunlight - Jet Propulsion Lab ephemeris of the sun • NOAA GEWEX-GCIP Solar Radiation from GOES imagery • NERR SWMP Ground-based pyranometers
Satellite Data Sets Variable Sensor Spatial Res Temporal Res Surface Air TOVS 1º 2/day 1980-present Temperature AIRS 50 km 2/day 2002-present SST / ASTER 90 m on Request 2000-present Ground MODIS 0.5-1 km 2-4/day 2002-present Surface AVHRR 1 – 5 km 1-2/day 1980-present Temperature AMSR-E 10 km 1-2/day 2002-present TOVS 1º 2/day 1980-present AIRS 50 km 2/day 2002-present Solar Rad GOES 0.5 º hourly 1996-present Clouds
Ground Based Datasets • Weather stations that we have deployed • National Climatic Data Center Integrated Surface Hourly (TD 3505) • Air Temperature, Wind, Clouds, Precip., Dewpoint • Global coverage (online 1990s – present) • NOAA NERR System Wide Monitoring Program • Water quality, Meteorological, Solar Radiation • U.S. National Data Buoy Center offshore buoy/CMAN data set • Air Temperature, Wind, Wave height • NOAA CO-OPS • Tide observations, some meteorological data, some SST Model-Based Datasets • NOAA/NWS North American Model (ETA) • NOAA/NWS Global Forecast System • NOAA/NCEP GFS Reanalysis 1948-2005 • GFDL Long Term Climate Scenarios
-5 -4 -3 -2 -1 0 +1 +2 +3 +4 +5 Model Performance vs. Field Data too cold too hot Difference in Monthly Average Maximum
Biogeography and climate - the Mediterranean mussel Black = winter SST 8°C Red = summer SST 30 ° C
Geographic Model PredictionsMussel species in Hokkaido 67% of species distribution patterns is explained by independent environmental variables
Sig. p=.025 Sig. p=.001 Sig. p=.001 Mussel Genotype Frequencies in California:1995 and 2005 The arctic species M. trossulus has increased in abundance since 1995
Geographic Model Predictions Barnacles in EuropeReproductive Failure if SST > 10°C in winter • Sea surface temperatures (AVHRR 36km) in February 1984 and 1998. The 10°C winter isotherm moved from northern Spain to Brittany. The left arrow is the southern limit of S. balanoides in 1985, the right arrow was our prediction for 2003 in our grant proposal. • 2005 Field surveys from Southern Portugal to Denmark by our group indicate our prediction was correct.
Ecological Forecasting /Nowcasting/ Hindcasting in the Intertidal Zone • Validated body temperature model • Linked to output of North American / Global Forecast System • 7-14 day forecasts of intertidal body temperature on demand for locations worldwide • Hindcasts of intertidal body temperature back to 1948 for locations worldwide to test hypotheses of links between climate change and biogeographic change • We are currently building a module for intertidal skin and subsurface (body) temperature within the structure of the land surface module (NOAH) of the NAM/GFS used by NWS for weather prediction.
Collaborators • PIs: J. Hilbish, V. Lakshmi, H. Power, S. Woodin • Post doc: S. Gilman • Students and teachers: P. Brannock, S. Jones, K. Jones, J. Jost, A. Smith, L. Szathmary • Logistical support: C. Blanchette, B. Broitman, P. Halpin, C. Harley, G. Hofmann, M. O’Donnell, Packard-PISCO techs
Related Value Added Projects • NOAA Ecological Forecasting • Biogeography and climate (E Pacific, W Atlantic) • PI Wethey, Co PIs Helmuth, Hilbish, Lakshmi, Woodin, Power • Barnacles, Mussels, Sedimentary Organisms • Baja California to Alaska • South Carolina to Maine • ONR Science & Technology • Real time measurement of behavior in infauna • PI Woodin, CoPIs Wethey, Marinelli • Worms and burrowing shrimp - pressure sensor development
NASA Earth Science Enterprise National Science Foundation (IBN 9985878 and OCE 0320064) National Oceanic and Atmospheric Administration (Ecofore NA04 NOS4780264) Office of Naval Research