Download
1 / 1
10 likes | 115 Views
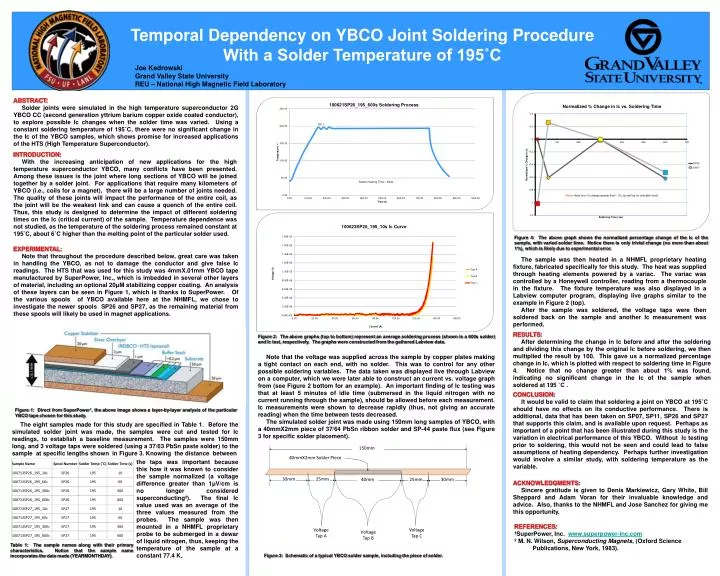
150mm. 30mm. 30mm. 25mm. 25mm. 40mm. 40mmX2mm Solder Piece. Voltage Tap A. Voltage Tap C. Voltage Tap B. Temporal Dependency on YBCO Joint Soldering Procedure With a Solder Temperature of 195˚C. Joe Kedrowski Grand Valley State University

E N D
150mm 30mm 30mm 25mm 25mm 40mm 40mmX2mm Solder Piece Voltage Tap A Voltage Tap C Voltage Tap B Temporal Dependency on YBCO Joint Soldering Procedure With a Solder Temperature of 195˚C Joe Kedrowski Grand Valley State University REU – National High Magnetic Field Laboratory ABSTRACT: Solder joints were simulated in the high temperature superconductor 2G YBCO CC (second generation yttrium barium copper oxide coated conductor), to explore possible Ic changes when the solder time was varied. Using a constant soldering temperature of 195˚C, there were no significant change in the Icof the YBCO samples, which shows promise for increased applications of the HTS (High Temperature Superconductor). INTRODUCTION: With the increasing anticipation of new applications for the high temperature superconductor YBCO, many conflicts have been presented. Among these issues is the joint where long sections of YBCO will be joined together by a solder joint. For applications that require many kilometers of YBCO (i.e., coils for a magnet), there will be a large number of joints needed. The quality of these joints will impact the performance of the entire coil, as the joint will be the weakest link and can cause a quench of the entire coil. Thus, this study is designed to determine the impact of different soldering times on the Ic (critical current) of the sample. Temperature dependence was not studied, as the temperature of the soldering process remained constant at 195˚C, about 6˚C higher than the melting point of the particular solder used. Figure 4: The above graph shows the normalized percentage change of the Ic of the sample, with varied solder time. Notice there is only trivial change (no more than about 1%), which is likely due to experimental error. EXPERIMENTAL: Note that throughout the procedure described below, great care was taken in handling the YBCO, as not to damage the conductor and give false Ic readings. The HTS that was used for this study was 4mmX.01mm YBCO tape manufactured by SuperPower, Inc., which is imbedded in several other layers of material, including an optional 20μM stabilizing copper coating. An analysis of these layers can be seen in Figure 1, which is thanks to SuperPower. Of the various spools of YBCO available here at the NHMFL, we chose to investigate the newer spools SP26 and SP27, as the remaining material from these spools will likely be used in magnet applications. The sample was then heated in a NHMFL proprietary heating fixture, fabricated specifically for this study. The heat was supplied through heating elements powered by a variac. The variac was controlled by a Honeywell controller, reading from a thermocouple in the fixture. The fixture temperature was also displayed in a Labview computer program, displaying live graphs similar to the example in Figure 2 (top). After the sample was soldered, the voltage taps were then soldered back on the sample and another Ic measurement was performed. RESULTS: After determining the change in Ic before and after the soldering and dividing this change by the original Ic before soldering, we then multiplied the result by 100. This gave us a normalized percentage change in Ic, which is plotted with respect to soldering time in Figure 4. Notice that no change greater than about 1% was found, indicating no significant change in the Ic of the sample when soldered at 195 ˚C . Figure 2: The above graphs (top to bottom) represent an average soldering process (shown is a 600s solder) and Ictest, respectively. The graphs were constructed from the gathered Labview data. Note that the voltage was supplied across the sample by copper plates making a tight contact on each end, with no solder. This was to control for any other possible soldering variables. The data taken was displayed live through Labview on a computer, which we were later able to construct an current vs. voltage graph from (see Figure 2 bottom for an example). An important finding of Ic testing was that at least 5 minutes of idle time (submersed in the liquid nitrogen with no current running through the sample), should be allowed before each measurement. Ic measurements were shown to decrease rapidly (thus, not giving an accurate reading) when the time between tests decreased. The simulated solder joint was made using 150mm long samples of YBCO, with a 40mmX2mm piece of 37/64 PbSn ribbon solder and SP-44 paste flux (see Figure 3 for specific solder placement). CONCLUSION: It would be valid to claim that soldering a joint on YBCO at 195˚C should have no effects on its conductive performance. There is additional, data that has been taken on SP07, SP11, SP26 and SP27 that supports this claim, and is available upon request. Perhaps as important of a point that has been illustrated during this study is the variation in electrical performance of this YBCO. Without Ic testing prior to soldering, this would not be seen and could lead to false assumptions of heating dependency. Perhaps further investigation would involve a similar study, with soldering temperature as the variable. Figure 1: Direct from SuperPower¹, the above image shows a layer-by-layer analysis of the particular YBCO tape chosen for this study. The eight samples made for this study are specified in Table 1. Before the simulated solder joint was made, the samples were cut and tested for Ic readings, to establish a baseline measurement. The samples were 150mm long, and 3 voltage taps were soldered (using a 37/63 PbSn paste solder) to the sample at specific lengths shown in Figure 3. Knowing the distance between the taps was important because this how it was known to consider the sample normalized (a voltage difference greater than 1μV/cm is no longer considered superconducting²). The final Ic value used was an average of the three values measured from the probes. The sample was then mounted in a NHMFL proprietary probe to be submerged in a dewar of liquid nitrogen, thus, keeping the temperature of the sample at a constant 77.4 K. ACKNOWLEDGMENTS: Sincere gratitude is given to Denis Markiewicz, Gary White, Bill Sheppard and Adam Voran for their invaluable knowledge and advice. Also, thanks to the NHMFL and Jose Sanchez for giving me this opportunity. REFERENCES: ¹SuperPower, Inc. www.superpower-inc.com ² M. N. Wilson, Superconducting Magnets, (Oxford Science Publications, New York, 1983). Table 1: The sample names along with their primary characteristics. Notice that the sample name incorporates the date made (YEARMONTHDAY). Figure 3: Schematic of a typical YBCO solder sample, including the piece of solder.