Download
1 / 22
220 likes | 312 Views
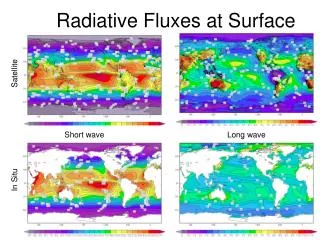
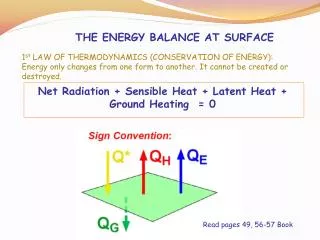
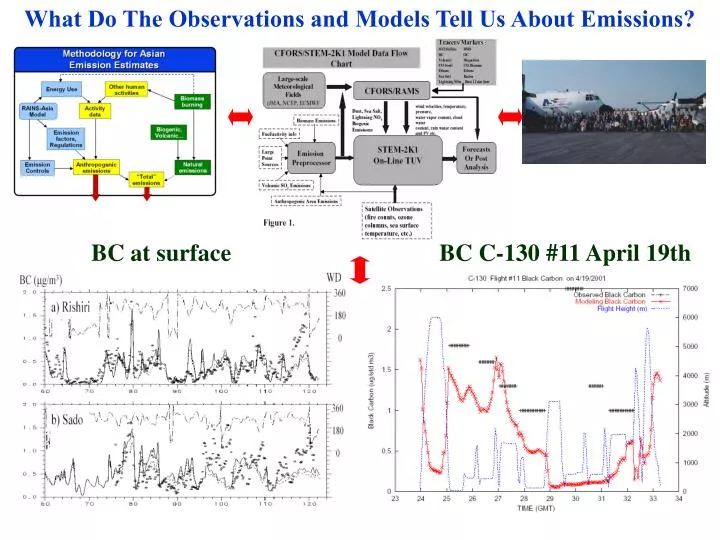
What Do The Observations and Models Tell Us About Emissions?. BC at surface. BC C-130 #11 April 19th. RF16 highly processed plume. RF7 highly processed plume. Field Experiments Employ Mobile “Super-Sites” & Provide Opportunities to Characterize Emissions. The Informatics Problem:

E N D
What Do The Observations and Models Tell Us About Emissions? BC at surface BC C-130 #11 April 19th
RF16 highly processed plume RF7 highly processed plume Field Experiments Employ Mobile “Super-Sites” & Provide Opportunities to Characterize Emissions The Informatics Problem: Observations Source Information Air Mass Markers Model Runs w/wo SourceSectors Freidli et al., JGR submitted
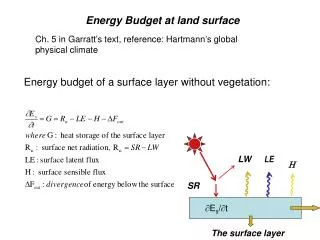
Schematic of Analysis Outline of the study STEM-2k1 NCEP RAMS, MM5
Example of Use of Model with Emission Markers Frontal outflow of biomass burning plumes E of Hong Kong 100 ppb Biomass burning CO forecast Observed CO –Sacshe et al. Observed aerosol potassium - Weber et al. Longitude
Large-Scale Structure is Captured by Model– But Peaks are Underestimated P-3B SO2 Data: Kondo et al., Thorton, Sacshe
Under-predicted Points Are In The Yellow Sea --- CO > 700 --- CO > 600 --- CO > 500 What does this tell us about the model? -Model deficiency? -Emissions problem? Figure 7
Observed and Modeled Ratios Can Be Classified By Source Region Using Trajectories - Age Can Also Be Estimated
The BC and CO Concentrations are Underpredicted – but the Ratios are Accurately Captured!! DBC/DCO This analysis suggests we need to look for improvements in a specific sector
Domestic Sector?? DC-8 Flight 9
The Importance of Fossil, Biofuels and Open Burning Varies by Region -- Richness of Emissions Data Base Can be Exploited
Estimated Emissions Observation Based Reconstruction > 3.7 > 3.7 a b Can Useful Emissions Information Be Reconstructed Using Observed Ratios (or Concentrations) ?
Regional Emission Signals Can be Identified and Tested Ethyne Two Relationships Are Observed Red Points Come From SE Asia –With Heavy Influence From Biomass Burning
? Modeled Observed
Top Down Approach (Inversion)emissions model predicted-fields compare predicted with observed emission inferences Kasabhatla et al., GRL, 2003
U. Iowa/Kyushu/Argonne/GFDL With support from NSF, NASA (ACMAP,GTE), NOAA, DOE, JST
Improvements Emissions Require Creative Combination of Bottom-Up and Top-Down Approaches Modeled Observed Bottom-Up Estimates
Tracers/Markers: SO2/Sulfate DMS BC OC Volcanic Megacities CO fossil CO-Biomass Ethane Ethene Sea Salt Radon Lightning NOx Dust 12 size bins CFORS/STEM-2K1 Model Data Flow Chart Large-scale Meteorological Fields (JMA, NCEP, ECMWF CFORS/RAMS wind velocities, temperature, pressure, water vapor content, cloud water content, rain water content and PV etc. Dust, Sea Salt, Lightning NOx Biogenic Emisisons Biomass Emissions Fuel/activity info STEM-2K1 On-Line TUV Emission Preprocessor Forecasts Or Post Analysis Large Point Sources Volcanic SO2 Emissions Anthropogenic Area Emissions Satellite Observations (fire counts, ozone columns, sea surface temperature, etc.)
Using Observed Megacity Ratios – Can We Cluster Cities? Extension to particles (b) BEJ (Beijing), TIJ (Tianjin), QID (Qingdao), SHA (Shanghai), HOK (Hongkong), SEL (Seoul-Inchon), PUS (Pusan), TOK (Tokyo)
Speciation of NMVOC Reveals Great DifferencesAmong Countries with Different Levels ofEconomic Development Cities Countries
Biomass burning Industry Domestic > 5.0 Ethyne
Use of Chemical Transport Models in Atmospheric Chemistry Field Experiments to Test/Improve Emissions