Download
1 / 17
170 likes | 299 Views
Surface Hoar Analysis at Summit, Greenland. Catherine Denoncourt University of New Hampshire Advisor: Dr. Robert Bindschadler. Discussion for Today. Background on Surface Hoar Background on SSM/I Passive Microwave Data Used Purpose:

E N D
Surface Hoar Analysis at Summit, Greenland Catherine Denoncourt University of New Hampshire Advisor: Dr. Robert Bindschadler
Discussion for Today • Background on Surface Hoar • Background on SSM/I Passive Microwave Data Used Purpose: In search of a correlation between Surface Hoar events and SSM/I Passive Microwave data from 85 GHz frequency
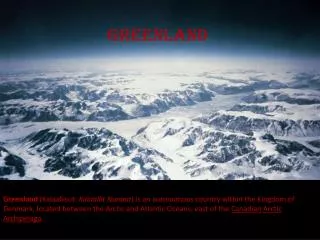
Summit, Greenland • Located at 72°N, 38°W • Situated atop ~ 3200 m of ice • Summer Temperature Varies from -30 to -5°C (Steffen, AWS Data) http://summitcamp.org
What is Hoar Frost? • Low density, coarse grained frost deposit • Formed when snow temperature is above air temperature • Vapor sublimates out of snowpack into hoar frost once hitting cold air • Conditions condusive to hoar: clear, cold day, light breeze (1-3 m/s) • At Summit, Surface Hoar usually occurs during Summer months
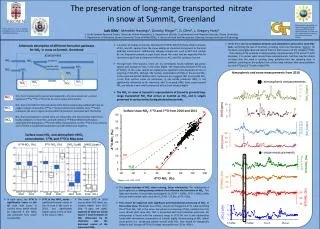
Data Used • In-Situ Observations (Dibb) • Weather conditions • Snow Surface conditions • EASE-Grid SSM/I Passive Microwave Satellite Data (NSIDC) measuring Brightness Temperature • Used 85 GHz frequency in the Vertical and Horizontal Polarizations
37GHz Wavelength of .81 cm Depth 10’s of cm in snowpack Used most often for snow surface studies Clouds invisible 85 GHz Wavelength of .35 cm Sensitive to surface change of snow Sensitive to clouds Passive Microwave Data37 GHz vs. 85 GHz
Conclusion • 85 GHz provides some capability to detect the majority of surface hoar frost events • Positive Curvatures and Large Negative Slopes on Vertical and Horizontal Polarization can help pinpoint Surface Hoar Frost Events
Many thanks to: Bob Bindschadler Chris Shuman Jack Dibb Patricia Vornberger Koni Steffen National Snow and Ice Data Center UNH/NASA GSFC Research & Discover Program